What is an Entity-Relationship Diagram?
Visualize the relationships between models in your app and tables in your database

Programmers often have to deal with big databases. It doesn’t matter what kind of coding language we’re using, there will always be information that we need to store in the backend of our application. It’s important to keep your DB organized so you can access information you need when coding. There are various ways to keep databases understandable for other programmers who are working with you. One that I really like using is the Entity-Relationship (ER) diagram:
What’s Considered a Good Database?
A database can be identified as a set of records that are logically related. Computer-based databases are normally organized as one or multiple numbers of tables.
A table consists of a series of rows and columns. Here are some of the things that are important when designing an effective database:
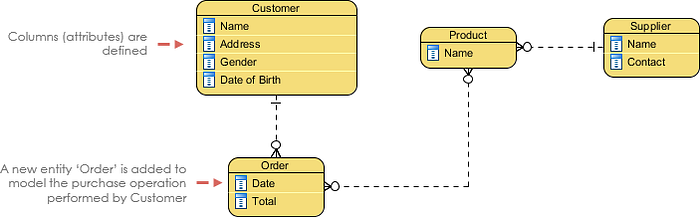
- Identify an entity as a logical collection of items related to the database. An attribute is a characteristic of the entity.
- That the physical counterpart of the entity is a database table and the physical counterpart of the attribute is the column.
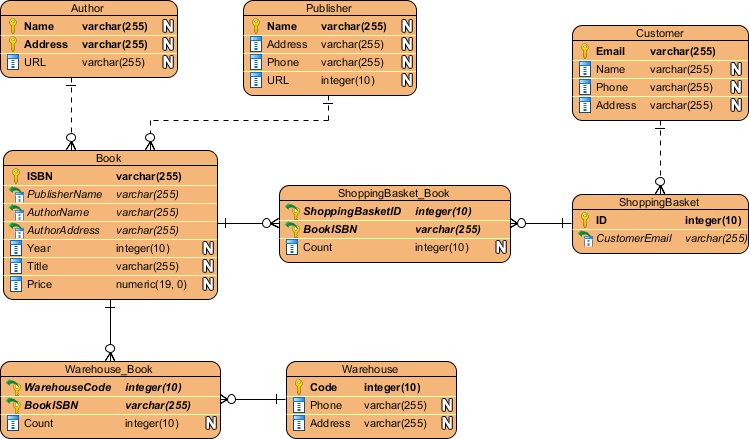
- A primary key is identified as an attribute that uniquely identifies each instance of an entity.
- The logical link between two entities is the relationship.
- When the primary key of a parent entity exists in a child entity, it’s called a foreign key.
What Is an ER Diagram?

Entity-Relationship Model is a structural diagram model. An ER diagram contains connectors and symbols. It’s called an Entity Relationship Diagram because we are referring to entities within the system scope and their relationships.
An entity is referred to as an object. For example: students, products, companies and relationships are among these objects. When we say relationships we’re referring to how these objects are related to each other.
Why Levels of Abstraction?
An ER diagram is drawn up to three levels of abstraction: conceptual, logic, and physical model. All three levels of abstraction contain information about entities and relationships — they differ in the way they are created on each level.

The conceptual DB model is more often used by business analysts. At this level of abstraction, we only display the models we need to work with and the relationships among them. We just display an overview of how the DB is going to look, and the ‘one-to-many’, ‘many-to-many’, and ‘one-to-one’ relationships among them.
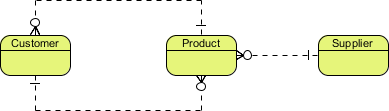
A logical data model is a conceptual data model with more information. In this model, we also define the columns known as attributes and expand our relationships more, so the information that we are trying to set on the database isn’t repeated as often.
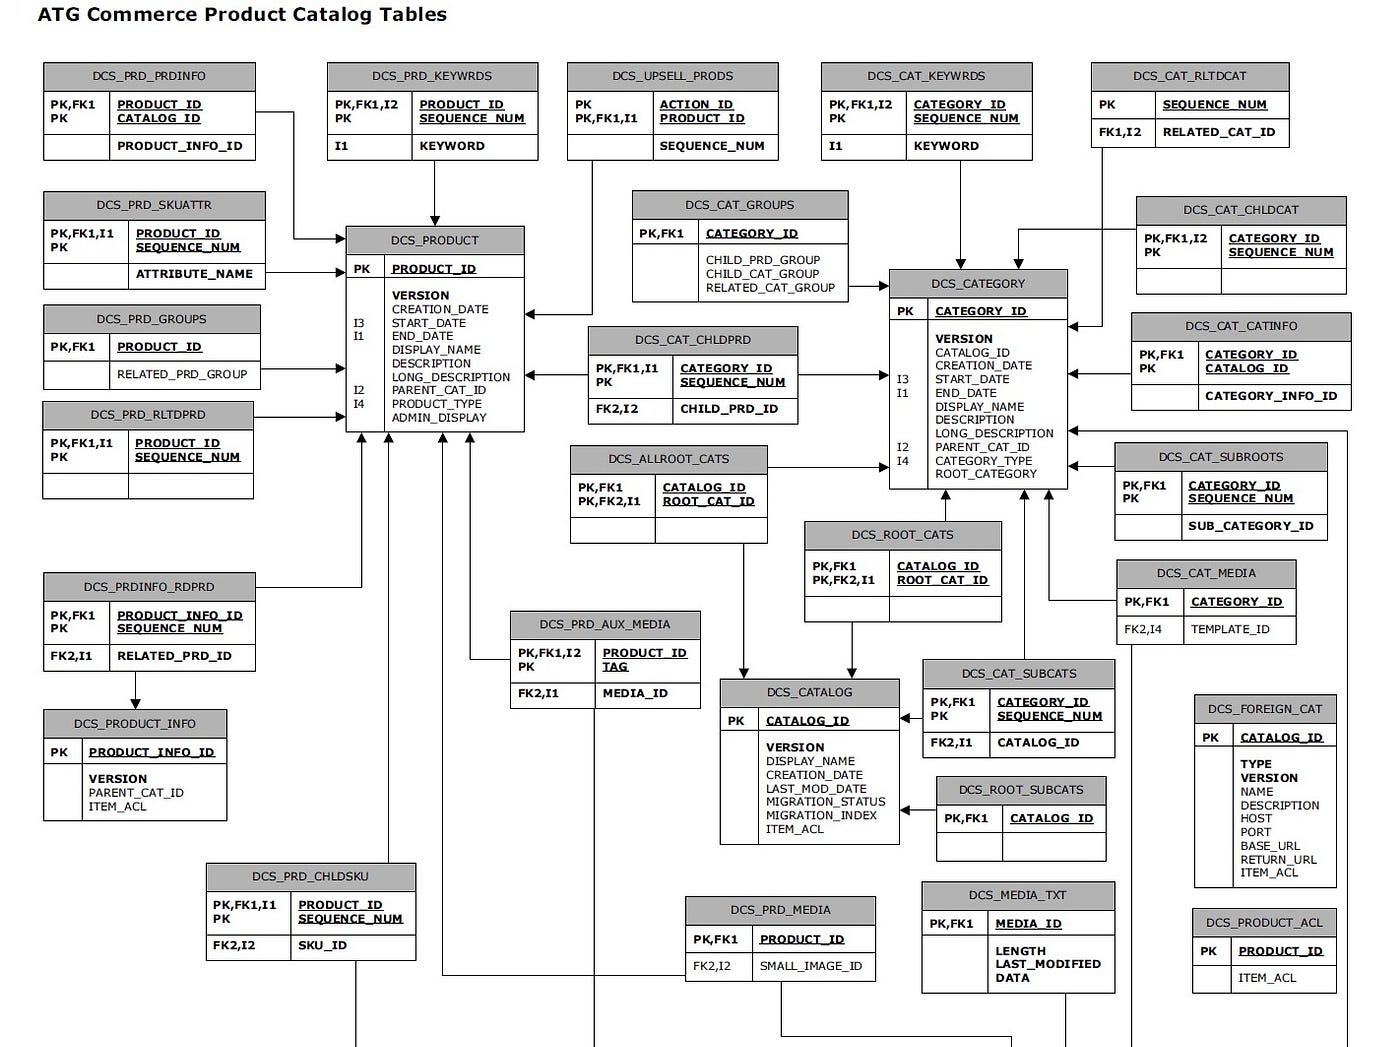
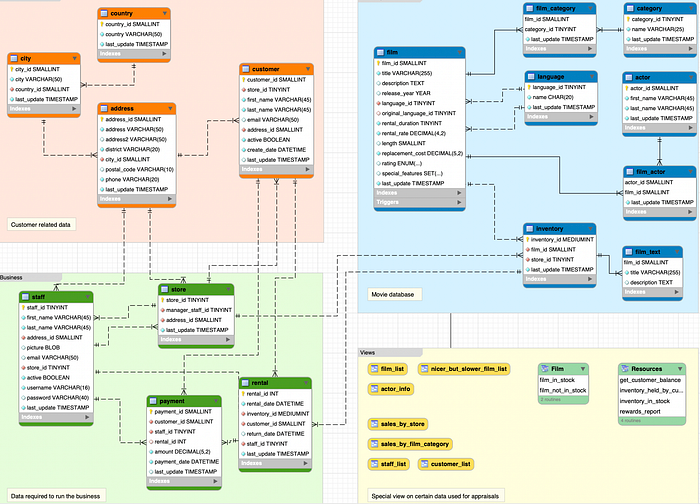
The physical data model represents the actual design of the database known also as a sophisticated version of the logical data model. After finalizing the physical model, each column is displayed with its data type, length of that specific data type, private keys, foreign keys and so on. At this level of abstraction, we set all the restrictions and requirements of our database.
How to Generate an ER Diagram
- Confirm the purpose of the ERD model. Try to separate the levels of abstraction, so that on each abstraction you know what each level is missing.
- Create your entities and the relationships between them. Start with three tables and then try to separate them if you’re getting repetitive data.
- If you started with three tables you can easily end up with five tables or more. This means you can access information more easily after separating them. Believe me, it’s easier to filter information with primary and foreign keys than with 100 columns holding the same information.
- Give your entities columns and name the attributes that you need for each of them.
- Finally set up your attributes, give them specific data types and set up your primary keys and foreign keys. Also, don’t forget for each data type to set up their restrictions and requirements.
There are various tools that you can use to create ER diagrams:

Ones that I really like working with are MYSQL Workbench and SQL Serve. Especially if you are new to databases, they will help you code along and create the diagrams at the same time.