How To Use DALL-E API for Data Visualization
From datasets to a text prompt to generated images
This is Part 1 of a two part blog post exploring how DALL-e can be used for data visualization. For Part 2, see Communicate Data More Effectively Using the DALL-E API
DALL-E is open for public use now, and most people have focused on exploring its capabilities to see how accurately or creatively DALL-e can depict prompts.
It’s mind-blowing and a lot of fun to play with.

After playing with DALL-E for a few months, I’ve been curious how it might support uses beyond the creative and fun.
One application I’ve been considering: data visualization.
I decided to experiment and start exploring Chernoff Faces. They’re a type of data visualization that uses facial features to represent different data points. Chernoff Faces are typically used to visualize multi-dimensional data sets, i.e., have many different variables to consider.
Data Visualization, Chernoff Faces, and DALL-E
Chernoff Faces are cartoonish line drawings where one facial feature corresponds to a field in the data set.
For example, in a hypothetical weather data set, you might have:
- Temperature → Shape of the eyebrows
- Air pressure → Size of the eyes

Chernoff Faces use humans’ inherent ability to recognize faces and small changes in facial characteristics. If you’re curious to learn more, see Edward Tufte’s “The Visual Display of Quantitative Information [Amazon].”
Could DALL-E’s ability to generate more realistic faces help convey the data more impactfully?
The Approach
To start exploring, I picked an open source dataset. I went with a variation of the Cleveland Heart Disease dataset from the UCI repository.
I then selected a subset of the dataset’s features (sex, age, blood pressure, smoker, family history of heart disease) and mapped them to Chernoff’s facial features.
The mapping I created was:

Using the rules defined in the table, I wrote a Python app that converted each row in the data set to a text prompt.
For example, given these rows:
Row #1: Sex=F; Age=29; BP=135/90; Smoker=1; FHHD= 1;
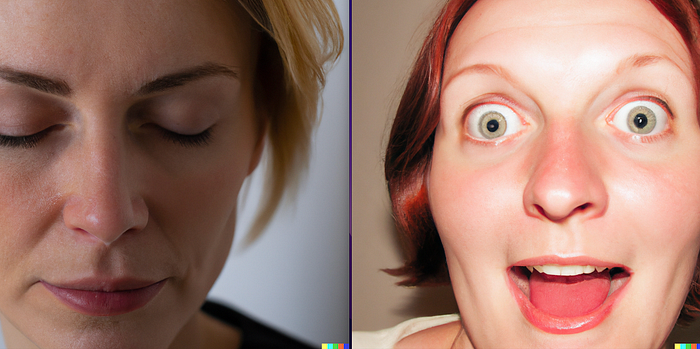
Row #2: Sex=F; Age=35; BP=80/65; Smoker=0; FHHD= 0;The Python app generated the following prompts:
Row #1: A photographic portrait a 29 year old woman’s face with red hair, opened mouth, and wide open eyesRow #2: A photographic portrait a 35 year old woman’s face with blonde hair, closed mouth, and closed eyes
The Results
Running these two prompts through DALL-E produced the following images:
Conclusion
As a first step, I think the results are pretty compelling just by looking at these two data points.
The obvious benefit: with the right field → facial feature mapping, the resulting image can include emotion in a way that’s not expressed in the cartoonish equivalent. I think DALL-E’s ability to generate faces images in this way makes it an incredibly interesting tool for data exploration.
The obvious challenge: with a limited ability to control features in the generated image, it would be tough to make nuanced distinctions between individual faces.
But all in all, I think there’s potential now and certainly in the future as it becomes possible to overcome challenges.
What do you think?
This is Part 1 of a two part blog post exploring how DALL-e can be used for data visualization. For Part 2, see Communicate Data More Effectively Using the DALL-E API

