Musings on Tracing
Using AWS Distro for OpenTelemetry with Jaeger
A tale of two Collectors

Summary
So far I’ve been talking about different aspects of running OpenTelemetry in distributed architectures and introduced Jaeger Quick Start to simplify the deployment of this tracing platform in the AWS environment. Now it is time to bring everything together and demonstrate a complete example of using AWS Distro for OpenTelemetry (ADOT) and Jaeger as a tracing backend.
The goal for the series
It’s long overdue to clearly state the goal for this series of posts. Better late than never though.
I want to persuade you that tracing is a practical and valuable concept, not just theoretically interesting. I’m approaching this from DevOpsy angle of infrastructure deployment and initial configuration — the boring topics we need to settle before we move on to more useful things.
In particular, I’m aiming for the audience that is familiar with AWS environment and has some experience with AWS X-Ray — the official tracing offering from AWS. Through OpenTelemetry and other open-source products like Jaeger, I demonstrate that you have an option to evaluate different tracing platforms. I’m arguing that by adopting OpenTelemetry you can even run multiple tracing platforms side by side, examining them and making a conscious decision about what works best for your organization.
OpenTelemetry + Jaeger = ❤️
Before we move on any further, a quick reminder of the OpenTelemetry Collector architecture (for in-depth discussion see Approaching OpenTelemetry):
OpenTelemetry Collector is the main component that ensures telemetry signals (traces, metrics, logs) are received, processed, and exported. As an OpenTelemetry user, you are responsible for Collector pipelines — you can pick from a registry of available receivers, processors, and exporters to build the exact pipelines you need.
OpenTelemetry defines a list of recommended processors — worth taking a look.
Jaeger architecture is also built around Collector. Similar names are not a coincidence here — Jaeger founder, Yuri Shkuro is also an OpenTelemetry co-founder and an active member of the community. Jaeger Collector can receive trace spans in various formats and handles efficient storage of the data, using one of the supported storage backends — at the time of writing these are Elasticsearch, Cassandra, and Kafka.
Bringing it all together, when the OpenTelemetry pipeline is configured to export traces to the Jaeger platform, the trace flow looks like this:

At this point you may ask a valid question — why do we need another Collector? Recall that this is a big deal operationally — think about deploying, scaling, patching, monitoring, and troubleshooting. Wouldn’t it be easier if we export traces to Jaeger storage backends directly from OpenTelemetry Collector?

Jaeger was created before OpenTelemetry. This explains why we have Jaeger Collector but do not have (yet) OpenTelemetry Exporters that support Jaeger storage backends.
In fact, this is exactly the direction Jaeger team is thinking about. However, we are not there yet and both Collectors have to be present. It may seem like a setback, but let’s go one step further to understand how AWS Distro for OpenTelemetry fits in.
The referenced GitHub issue is a very interesting read that helps to better understand relationships between OpenTelemetry and Jaeger as well as feature overlap between them.
ADOT + Jaeger = ?
As we discussed above, OpenTelemetry Collector can be configured to export the traces to Jaeger Collector via the configuration file using the Jaeger exporter. Can the same be done with ADOT?
In theory, it should be the same thing — ADOT is just an OpenTelemetry distribution, tailored for the AWS environment. Right?..
Not quite. Remember that an OpenTelemetry distribution can both add and remove certain OpenTelemetry components and ADOT is not an exception. It adds AWS-specific components but it also removes some from the base distro, mainly to keep the distro compact and reduce the testing surface. What’s important for today’s post — there is no Jaeger exporter available in AWS Distro for OpenTelemetry.
Despite the fact that there is Jaeger exporter for OpenTelemetry available, it is not included into ADOT (yet?) and, therefore, there is no built-in way to configure ADOT-based applications to export spans to Jaeger.
It means we can’t directly build ADOT -> Jaeger trace processing pipeline. It may be disappointing when you first encounter this, but I’m going to argue below that this is actually not a (very) bad thing.
There are multiple ways to address this obstacle and export OpenTelemetry traces from the ADOT-enabled application to Jaeger:
- OpenTelemetry Collector in front of Jaeger
- Custom ADOT Collector packaged with Jaeger exporter
This post focuses primarily on the first approach as it can be used with the latest OTEL Collector releases, including all processor/exporters from the opentelemetry-collector-contrib repository. We’ll cover the process of building a custom ADOT Collector in future posts.
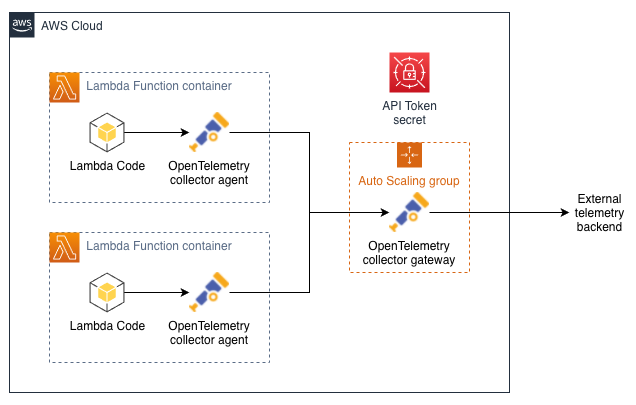
Gateway OTEL Collector architecture
Instead of trying to export spans to Jaeger directly from ADOT, let’s introduce another OpenTelemetry Collector in front of the Jaeger platform:

The architecture above may feel wrong — now we have two OpenTelemetry Collectors, seemingly just to work around the fact that ADOT does not include Jaeger exporter. It may be indeed the case if you have a single service — but what if you have tens or hundreds of them?

Suddenly, the architecture with OpenTelemetry Collector deployed as a gateway looks much more sensible. Gateway Collector is a way to standardize your telemetry processing pipelines, instead of replicating the same configuration over and over in each service. With this architecture in place, ADOT Collectors act as “dumb” agents, forwarding telemetry signals to the gateway Collector that in turn perform the main processing.
Here is what you can do with this architecture in place:
- Implement advanced sampling policies across your distributed architecture, including tail-based sampling
- Capture metrics based on the spans collected across your services. This is especially valuable as you can capture metrics based on the spans that will be dropped by your sampling rules.
- Centralize export of telemetry signals (along with secret management) to external backends — such as Jaeger or DataDog
- Efficient scaling — ADOT Collector is running close to service and, therefore, is supposed to be very lightweight to ensure that application performance is not affected by tracing. In contrast, gateway OpenTelemetry Collector can be deployed and scaled independently, based on the total telemetry volume across all services
- Gateway Collector is a way to enforce org-wide security/networking controls and decouple telemetry producers (usually, service teams) from telemetry management (platform team).
The obvious disadvantage of this architecture — it adds another hop to the telemetry pipeline and makes it more complex, especially from the operational point of view.
I would argue that the advantages you get greatly outweigh the disadvantages the more services you have in your distributed architecture.
Good news — Jaeger Quick Start
I hear you sigh deeply and reluctantly matter:
OK. That gateway thing makes sense. I would try this out and compare Jaeger with X-Ray. However, it feels like this requires a lot of work and I’m not ready to invest into this right now.
In the previous post, I introduced Jaeger Quick Start project that addresses this use case. The Quick Start automates the initial Jaeger deployment and configuration on AWS with reasonable defaults, so you can “start quickly”. For the purposes of this blog post, Jaeger Quick Start provides an option to deploy not only Jaeger itself but also a pre-configured OpenTelemetry Collector in front of it:

This actually means that once you have Jaeger Quick Start deployed in your environment, you can use it straight away — no code changes in your ADOT services are necessary (yay!). All that is needed is to adjust the ADOT Collector configuration to forward the traces to the gateway Collector in front of Jaeger.
ADOT Collector configuration
For the demonstration part of this post I’m going to use a simple event-driven architecture we covered in detail in the previous post:

The complete source code of this application along with the necessary deployment instructions can be found in kolomiets/tracing-playground repository on GitHub.
As we are using ADOT Collector in the demo application, we can use OPENTELEMETRY_COLLECTOR_CONFIG_FILE environment variable to override the default Collector configuration and add a custom one with the trace processing pipelines adjusted (compare this with the default config—the changes are marginal):
With this configuration in place, we export the same traces to both AWS X-Ray and Jaeger backends. This is very useful to evaluate both platforms.
We use environment variable expansion for the OTLP endpoint in the configuration above. This is a neat technique to keep your Collector configuration files simple and static. Expansion also allows you to reconfigure the endpoint by updating JAEGER_OTLP_ENDPOINT variable — no need to change the configuration file and redeploy the whole service.
So, can I see the traces, please?
Yes!
Now, with all the configuration bits out of the way, we can run our demo application (see the instructions in GitHub repo) and finally see the traces in both AWS X-Ray and Jaeger. Let’s start with AWS X-Ray:

This is the familiar trace we’ve seen when we examined context propagation with OpenTelemetry. Nothing particularly new here. Let’s switch on to Jaeger:

Jaeger shows a number of captured traces — note different colour codes for services involved. If we dive deeper and open a trace, we’ll get span details:

Each span contains OpenTelemetry span attributes — the main source of information about a span. For example, here are the attributes for Kinesis.PutRecord span:

Jaeger has an analogue of AWS X-Ray Service Map feature available at System Architecture tab:

The numbers on the edges show the total number of traces captured along the edge
You may notice that Jaeger’s system architecture is different from what we’ve seen in AWS X-Ray. Nodes for the lambda functions are present but we do not see the nodes for AWS services: Lambda, SQS, Kinesis, SNS. It looks like we’ve been able to capture all the spans explicitly created in the lambda functions, but there are no spans emitted by AWS services. What is going on here?
The answer lies in how AWS services are integrated with AWS X-Ray. As mentioned in the documentation, some services (such as AWS Lambda or Amazon API Gateway) add additional nodes to the service map. In other words, there is built-in integration between certain AWS services and AWS X-Ray and OpenTelemetry can’t help us with these additional spans. This is why we don’t see them in Jaeger (as Jaeger receives only the spans that OpenTelemetry Collector gets).
This is not the only difference between the traces captured by AWS X-Ray and Jaeger, but probably the most visible one. I’d like to pause the discussion here and defer further analysis to the next post — this is a big topic on its own.
Conclusion
Before we wrap up, let me summarize the main ideas we’ve covered in this post.
OpenTelemetry Collector in a gateway mode is a good pattern to consider, especially for systems with a large number of services. This is a perfect way to standardize and enrich your telemetry processing pipelines, reducing telemetry overhead for each individual service.
AWS Distro for OpenTelemetry can be configured to export the traces not only to AWS X-Ray (which is the default behaviour) but to other backends as well. This enables you to run multiple tracing backends side by side — invaluable for migrations, evaluations, and POCs.
Jaeger Quick Start simplifies provisioning of the Jaeger telemetry platform in your AWS environment, ready to be plugged into your OpenTelemetry pipelines.
Traces captured by ADOT and exported to Jaeger are different from the traces you observe in AWS X-Ray. Partially this is because of direct integrations between certain AWS services and AWS X-Ray. The analysis of these differences will be covered in further posts of this series.
And, finally, the main achievement — with all the groundwork covered and codified in Jaeger Quick Start and demo applications, I stop talking about deploying and configuring Jaeger :) In the next posts, we will talk about the traces themselves and the benefits that OpenTelemetry provides.
Resources
- Jager Quick Start Deployment guide
- kolomiets/quickstart-jaeger — Jaeger Quick Start project
- kolomiets/tracing-playground — the demo application we discussed
