Member-only story
Understand the MySQL Index Optimization Artifact
MySQL index optimization tutorial
With the increasing number of users and data volume, the slow query is an unavoidable problem. In general, if a slow query occurs, it means that the interface responds slowly, the interface times out, and other problems.
If it is a high concurrency scenario, the database connection may be full, which directly leads to the unavailability of the service.
Slow queries do cause many problems. How can we optimize slow queries?
The main solutions are:
- Monitor the execution of SQL, send email and SMS alarms, and quickly identify slow query SQL.
- Enable the database slow query log function.
- Simplify business logic.
- Code refactoring and optimization.
- Asynchronous processing.
- SQL optimization.
- Index optimization.
Today, I will focus on index optimization because it is the most effective way to solve the problem of slow query SQL.
How to check the execution status of a SQL index?
Yes, by adding the explain keyword in front of SQL, we can see its execution plan. Through the execution plan, we can clearly see the execution of the table and index, whether the index is executed, the order of index execution, and the type of index Wait.
The steps of index optimization are:
- Use explain to view the SQL execution plan.
- Determine which indexes are inappropriately used.
- Optimizing SQL, SQL may require multiple optimizations to reach the optimal value for index usage.
What Is Explain?
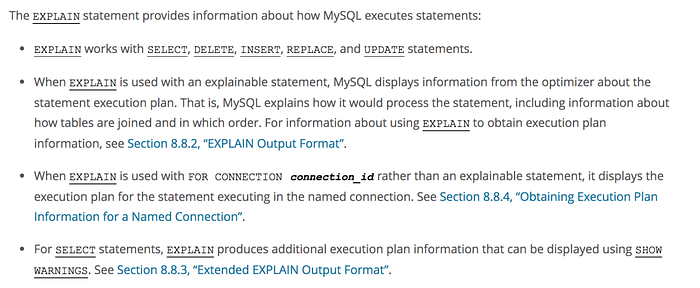
Let’s take a look at how the official documentation of MySQL describes explain:

The syntax of explain:
{EXPLAIN | DESCRIBE | DESC}
    tbl_name [col_name | wild]

{EXPLAIN | DESCRIBE | DESC}…
