The Beginner’s Guide to Performance Testing With Apache JMeter
Load test your application before you need it

The developer’s job is not finished with just development. Sometimes, they are asked to carry out performance testing for the binary to see how it behaves under a particular load.
Writing code for the performance tests might become time-consuming. Developers could use tools already at their disposal, such as JMeter, k6, etc.
What Is Performance Testing?
Performance testing is a form of software testing that focuses on how a system running the system performs under a particular load. Performance testing should give organizations the diagnostic information they need to eliminate bottlenecks. — Stackify
There are two types of performance testing:
- Load testing
- Stress testing
Load testing is exerting an anticipated load on the software and observing its behavior and performance.
Stress testing is exerting loads way beyond the load the software was intended to handle. The breaking point of the software could be determined by this test when the software starts giving errors or it slows down.
Why Is It Needed?
It is needed to understand the load the binary or software could handle without breaking. The sole responsibility for such a test is to find a breaking point. Sometimes, under high load, there might be issues or bugs that arise from such a high load.
How Does JMeter Work?

JMeter is an HTTP client that can run multiple sessions in parallel. It is configurable to your needs. Isn’t that the best part? But, JMeter is not just limited to HTTP, even though it’s used for HTTP testing. There are FTP, SMTP, and more samplers also.
Let’s Get Started!
In this article, we will be concentrating on JMeter on how to install it and configure load tests according to certain requirements.
Installation
- Install the latest 64-bit JRE or JDK.
Windows
Linux
macOS
Please follow the steps mentioned in the articles to install Java for your relevant operating system.
2. Install the latest version of JMeter for your computer.
Find and download the latest version of JMeter for your computer.
Move the downloaded file to the desired location and extract it.
If you move into the folder and then into the bin folder, you could see that there are various scripts to run JMeter in different modes.
How to run the JMeter GUI?
Windows
Run jmeter.bat to start the GUI, which is located in the bin directory.
Linux/Unix/macOS
Move to the bin directory from the terminal and run JMeter using ./jmeter.sh.
Can’t see the GUI yet?
If you cannot see the GUI yet, you should check the following:
- The
JAVA_HOMEenvironment points to the JRE or JDK installation folder. - The
JAVA_HOME/binfolder has been added to thePATHenvironment variable.
JMeter should be up and running if you see the GUI.

What Is a Test Plan?
In your test plan, you should specify the overall settings and outline the steps that you want JMeter to execute while it runs. For your own reference, you can also name it and add comments.
Let’s Learn How to Create a Test Plan
Let’s create a simple test plan.
1. Add a thread group
Right-click on the test plan. Click on Add -> Threads (Users) -> Thread Group.
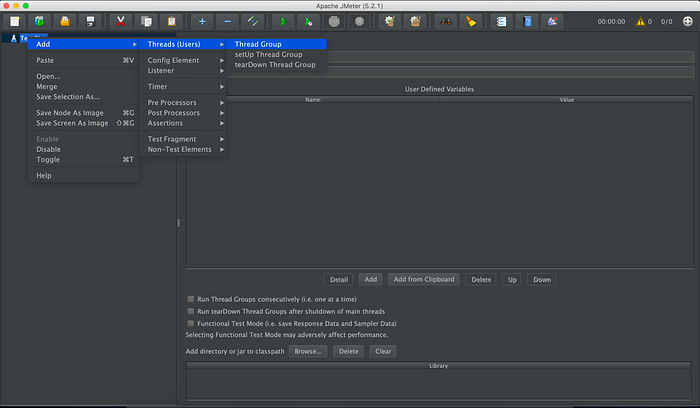
Thread Group is the container that holds the logic of how the user or thread should be simulated.
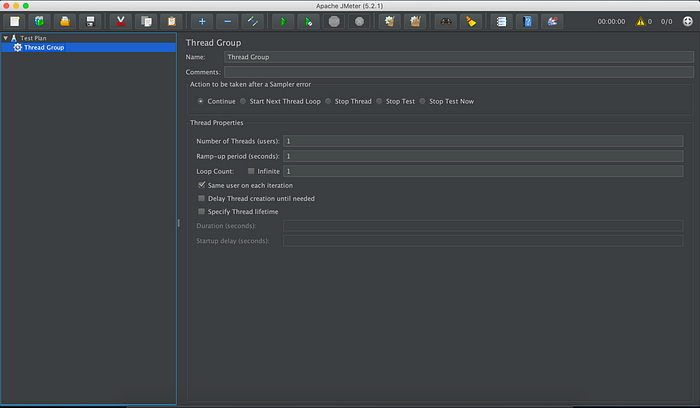
Let's talk about the settings in the Thread Group panel.
Action to be taken after a sample error
If an error occurs during execution of the test, you may let the test do one of the following:
- Continue: running
- Stop Thread: To stop current thread
- Stop Test: To stop test completely
Number of Threads (Users)
The number of threads simulated during the test.
Ramp-up period (seconds)
The time duration for the number of threads to be executed.
Loop Count
The number of iterations per user or thread.
Scheduler Configuration
- Duration (seconds): The duration of the test that should be performed.
- Startup delay (seconds): Number of seconds before each ramp-up period.
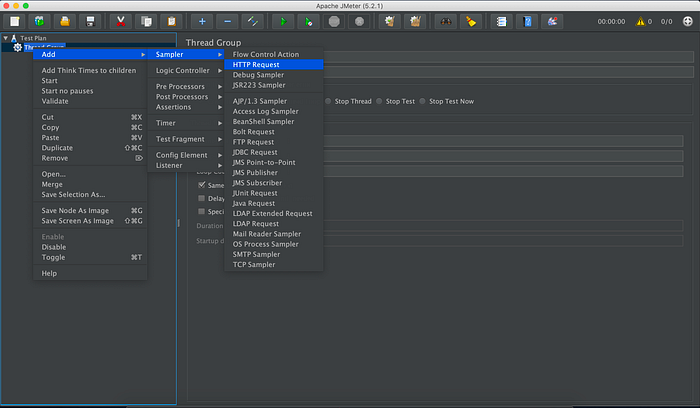
2. Create an HTTP request
Right-click on the Thread Group and then select Add -> Sampler -> HTTP Request.
I will show a simple example of a GET request to https://httpbin.org.
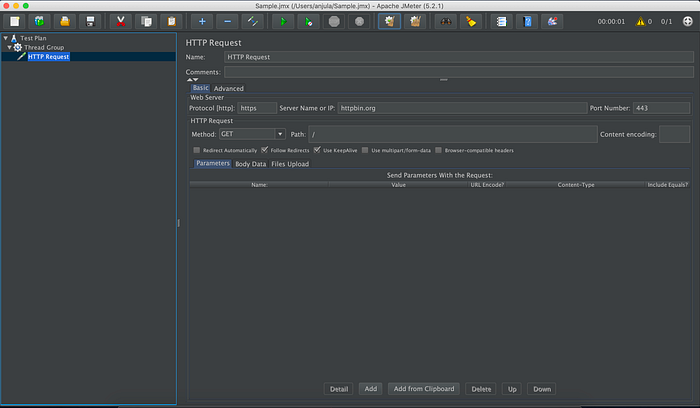
So, as I am performing a GET request to https://httpbin.org:
- Protocol: HTTPS
- Server name or IP: httpbin.org
- Port number: 443 (Default HTTPS port, could be omitted)
- Method: GET
- Path: /
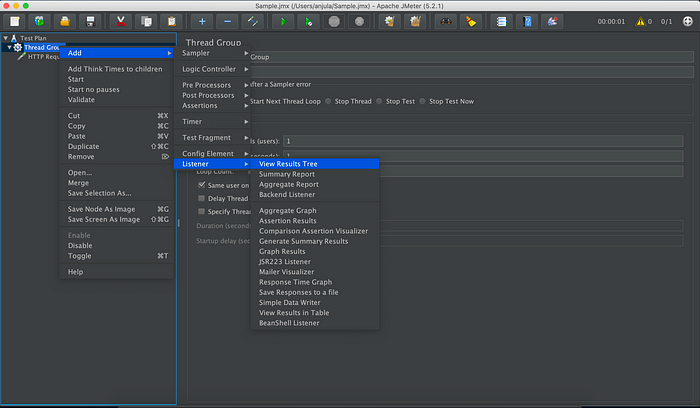
3. Add a View Result Tree
We can see the results after executing our request using the View Result Tree.
Right-click on the Thread Group and then select Add -> Listener ->View Results Tree.
Click on the Run button to run the test.
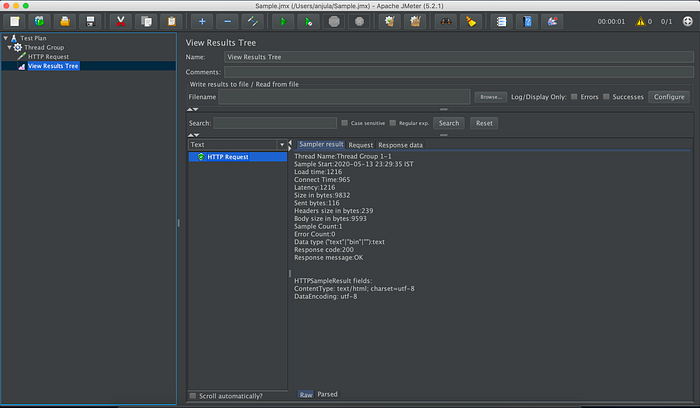
The UI listeners let you see the results and requests executed.
- Green color: Indicates success.
- Sampler result: Gives out the metrics of the requests and response times.
- Request: Shows the request that has been run.
- Response: Shows the response of the request.
JMeter stores all the requests and responses received. This listener is not designed to run multiple current users.
Is the article finished? Not at all!
Advanced Scenario
Let’s dive into an advanced scenario such as an e-commerce website test plan.
You can download the example JMX and open it in your JMeter.

So, what does the JPetStore buyer do?
- Sign-in to their account.
- View the catalog.
- Select a random category.
- Select a random product from a previously selected category.
- Add the product to the cart.
- Order the product inside the cart.
- Sign out.
This is a very common simulation of an e-commerce site. Let’s talk about the important features that are used.
1. CSV Data Set Config
If we take the e-commerce site as an example, every customer has their own account. We need to simulate it. So, we need to load user data using a CSV to make requests.
To do this, we add the CSV Data Set Config.
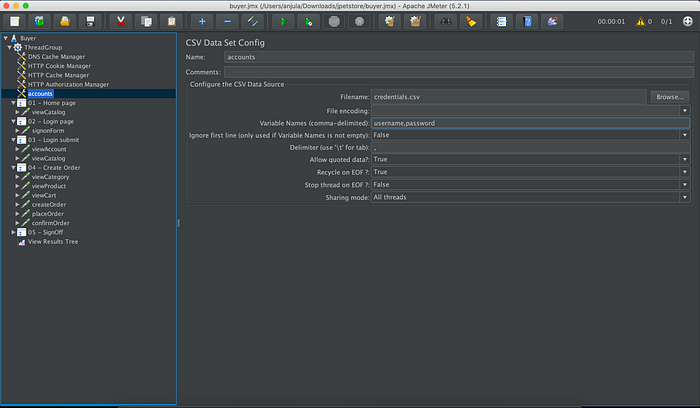
So that it points to the CSV file as follows.
username1,pass1
username2,pass2
username3,pass3
username4,pass4
As you can see, we have defined the:
- Variables names: Username and password .
- Delimiter:
,(The values of the CSV are separated by a comma).
There is no need for variable names (kept empty) if the CSV was as follows:
username,password
username1,pass1
username2,pass2
username3,pass3
username4,pass4
Let’s check how the loaded variables are used to simulate the logging in of users.
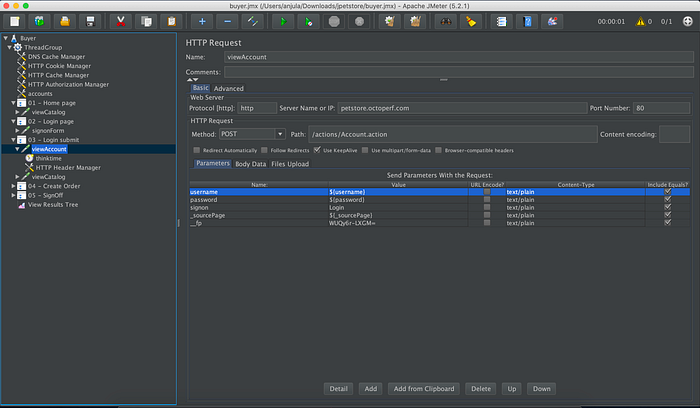
As you can see, the loaded variables have been defined as username and password field values. Now, different users logging in is simulated.
2. Dynamic parameters
Dynamic parameters are parameters within requests which are subject to change on every run. These parameters are sent in previous server responses. — Octoperf
This is a very important thing to know when load testing. You need to correlate them. You could follow the four-step procedure.
- Identify a dynamic parameter. Looks cryptic!
e.g.: RbLmXwd9bLS0l….- Find the cryptic value from the server response.
- You can use either a regular expression extractor or JSON extractor to extract the value into a variable for later use.
- Replace the value with a variable for request.
Let’s look into a server response.

Now, let’s use the regular expression extractor on the request whose response used the dynamic parameter _sourcePage.
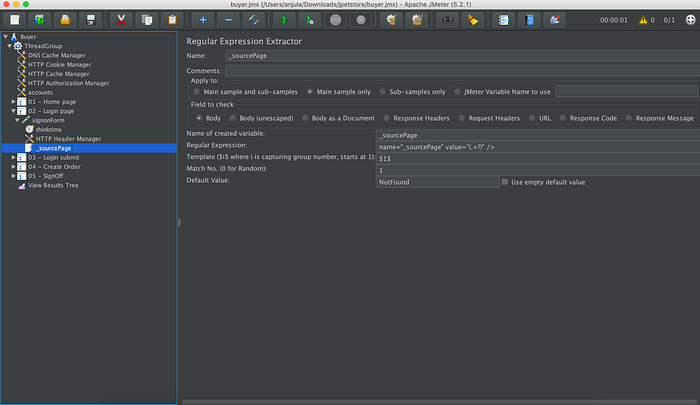
- Name:
_sourcePage - Regular expression:
name="_sourcePage" value="(.+?)" /> - Template:
$1$ - Match nr:
1
3. Random behavior
Let’s extract random categoryId and productId variables to simulate a dynamic user.
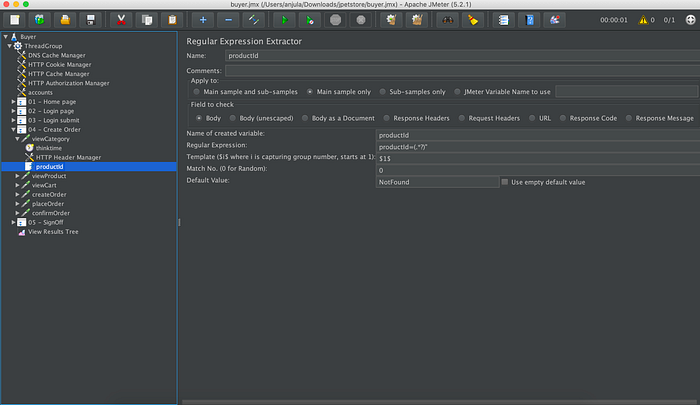
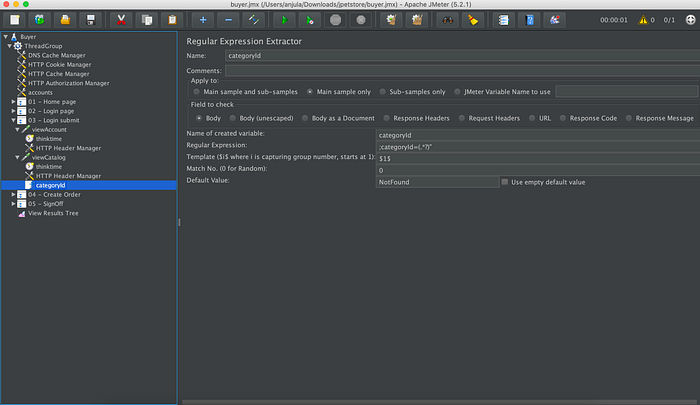
We have performed extractions on the pages containing the relevant IDs.
categoryId: Listing page of all categories.productId: Listing page of all products.
So, we use those variables to simulate users.
I hope you now understand how to do a performance test using JMeter.

