Member-only story
Set Up Thanos With Multi-Tenancy To Power Up Your Prometheus
Design a high-availability monitoring solution based on Prometheus and Thanos with multi-tenancy enabled
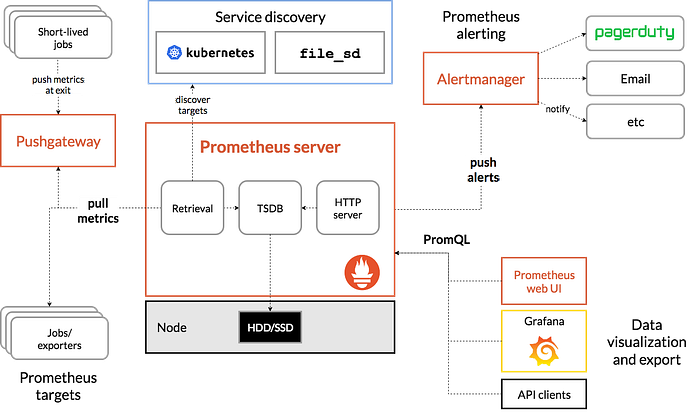
Prometheus is a well-known open source monitoring solution and the de facto standard for observability in Kubernetes environments.
It’s especially popular due to the fantastic operator that makes it easy to deploy a complete monitoring stack in a Kubernetes cluster:
- Prometheus gathers the metrics from dynamically found endpoints (pods, services, etc.) and then provides querying capabilities of stored metrics using PromQL.
- With AlertManager, you create your own rules to be notified when something is wrong, integrating with popular solutions like Slack or Pager Duty.
- Grafana can be added into the mix (not included in the operator) to have a nice dashboard over all these metrics.

There are a few things to understand about Prometheus’s way of operating:
- Prometheus scrapes metrics from configured endpoints at regular intervals.
- Endpoints (e.g. your application running in a pod) expose metrics on a port. You can use the official client libraries to do so in every popular language.
- Prometheus stores the metrics locally in a persistent volume. No object storage here!
On a side note, in the last few months, the Prometheus stack has expanded with:
This article will focus on the core stack and how to build a robust, scalable Prometheus setup.
Challenges
High availability
But what if you want high availability for your Prometheus setup? Usually, you would add a second instance, then some kind of load balancing in front of your two instances, and you are done.

