Resampling Imbalanced Data and Applying Machine Learning Techniques
What to do when your data isn’t balanced

Introduction

If you deal with machine learning problems, eventually you’ll encounter imbalanced data. So what is it?
Imbalanced data is what we have when the number of observations of one class in a dataset is significantly lower than in other classes.
Examples of imbalanced datasets:
- Data sets to identify rare diseases in medical diagnostics, etc.
- Datasets related to credit card fraud or credit card risk.
- Datasets related to estimating the risk of attacks on computer networks.
What Happens When a Dataset Is Imbalanced?
When you are applying machine learning algorithms with imbalanced data then your model obtained will be more biased towards the majority classes i.e your model will predict the majority classes instead of minority classes. Most of the machine learning models assume data to be equally distributed. This results in inaccurate predictions. Conventional machine learning algorithms are designed to reduce the error by increasing accuracy but they don’t take imbalances into account.
Metric Fool
Generally, we use accuracy as the metric measurement of our model. This makes us feel our model is accurate, but it doesn’t give us much understanding of the model.
For example, a dataset has 90% of total observations are of class A and 10% of total observations are of class B. TK Now, if you split your model and train your model then the majority of training dataset contains observations of class A and predicting the testing dataset labels you encounter your predicted observations are of class Aand giving more accuracy but in reality, you need to understand your model is more bias towards to class A and even not predicting one label of class B.

How to Identify Bias in the Model
We need to use the confusion matrix as the metric measurement of our model. For example, the confusion matrix for the model we discussed above looks like this:

If you see the class 0 has more observations and class 1 is not predicted which means the model is biased towards class 0 which is deciding our model is inappropriate.
How to Handle Imbalance in the Dataset
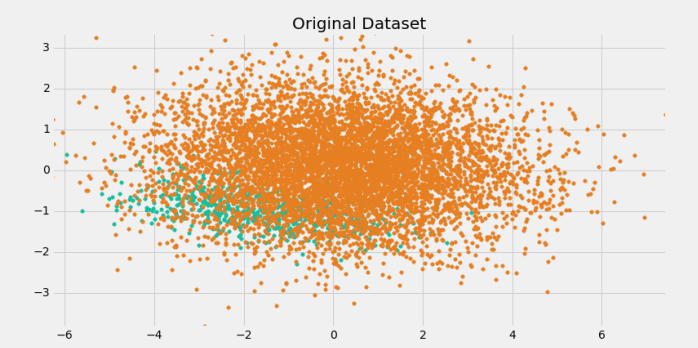
Let’s consider a credit risk classification dataset from Kaggle. Explore the dataset insights below.
- Boxplot on label class:

2. Counter plot on label class:
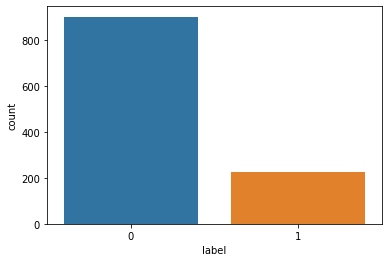
When we split the dataset after some preprocessing techniques, like dropping out null values into 20% as a testing set and 80% as the training set, and perform random-forest classification, we get the following results:
- Thw accuracy of the model is 80.88%
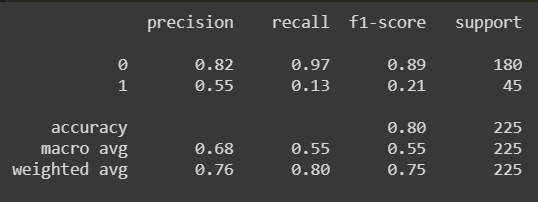
- Classification report:
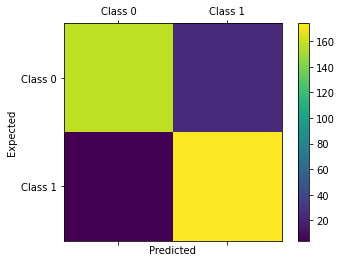
3. Confusion matrix:

By these evaluation metrics, we can clearly see that the model is more biased towards class 0 and is not a realistic model for class 1. We need to apply a strategy to make the model less biased so it can perform correct classification. A solution to this problem is to resample the data.
Resampling
Resampling is a method that consists of drawing repeated samples from the original data samples. It’s a nonparametric method of statistical inference — in other words, the method of resampling does not involve using generic distribution tables (for example, normal distribution tables) to compute approximate p probability values. Despite the advantage of balancing classes, these techniques also have their weaknesses.
There are two types of resampling widely used:
- Under-sampling
- Over-sampling

Undersampling involves randomly selecting examples from the majority class and deleting them from the training dataset. In the random under-sampling, the majority class instances are discarded at random until a more balanced distribution is reached.
Oversampling involves randomly duplicating examples from the minority class and adding them to the training dataset.
Implementation of resampling in the above dataset
In the above example, it’s clear that the minority class is 1, risk, so I’m applying oversampling to the dataset by increasing the observations of the risk class. Here’s the implementation:
Let’s collect the insights from the data we generated.
- Box Plot:

2. Counter plot:

Now we need to split the data into training and testing set. We do this by taking the test size as 20% and applying a random forest classification to this data. Then we evaluate the metrics to get the insights.
The following are the results obtained by evaluating metrics:
- Accuracy: The accuracy of the model is 92.22%
- Classification Report:

3. Confusion matrix:
After observing the above results we can say the model is working well in predicting the results.
Conclusion
This is how we can make our model unbiased when we encounter the imbalanced data problem in machine learning.
Thanks for reading!

