Performance Testing in TypeScript
k6 ️loves TypeScript

RIP JMeter. Cut to thousands of performance-test engineers cheering in celebration. I don’t know of anyone in the performance-test arena who still champions it (unless forced to by a sadistic manager).
Luckily, there are now a range of excellent open-source alternatives to use. They all come with their own issues and eventual cloud-hosting costs; however, one stands out from the crowd as actually having been built with performance-test engineers in mind. It’s called k6. And with it, you can build performance-test frameworks that are super fast, super flexible, and written in TypeScript.
TL;DR: k6, like Lego, lets you create whatever you want. It’s also collaborative, immensely rewarding, and fun. I’ve created an example framework for you to play with.
Why TypeScript?
Because performance testing is about handling a lot of test data. Usually that data is stored in JSON objects. It’s dynamic and is sent and received by HTTP requests and responses.
Now, imagine you had types or interfaces for each of those JSON objects. Wouldn’t parsing and handling that data in your test framework be 100x easier? And what if I told you there were tools that could convert a Swagger/OpenAPI document into these types for you? Parameterizing your performance tests would be trivial and stress free.
Why k6?
There are a number of reasons to use this tool over other open-source performance-test tools:
- You can script with it. Every application under test is unique, so the test framework needs to be also.
- It’s fast and lightweight. It ultimately runs in Golang, which is quick, stable, and designed for concurrency. It’s ideal for running lots of VUs without having to go for expensive cloud options.
- It integrates beautifully with your CI/CD pipeline, making trend analysis easy.
- It plugs into popular open-source monitoring applications, such as InfluxDB and Grafana.
- It has some of the best documentation and support I’ve seen.
But ultimately k6 is a toolkit. And unlike any other performance test tool out there, custom metrics, tags, checks, and thresholds allow you to monitor the application state in exhilarating detail.
In my example framework, I monitor how many crocodiles are being created at any one point, but this is just the tip of the iceberg.
Do you want to know how many assets were in the system when it started to show performance issues? Or how many users were performing a particular action? How many uploads were happening? How many had logged in or out? Or many, many more things? Everything and anything is possible.
Learn InfluxDB queries and Grafana dashboards, and you’ll have a performance-test environment looking like it was built specifically for your application.

However …
It doesn’t currently support socket.io. So if your application under test is using this technology, it may be worth looking elsewhere. It’s also growing fast, so there’s lots of useful functionality in the pipeline, including the clustered execution mode.
k6 is so lightweight we haven’t needed it so far, but it does feel like a must-have to future-proof the product.
Getting Started
Enough chatter — let’s do some performance testing. To help you get started, I’ve put together a performance-test framework using k6 and TypeScript. Let’s clone the repo and get started.
Note: Most things should work on both Windows and Linux (or Mac); however, I’ll point out where there are differences.
The Test Website
We’ll be using the loadimpact test API as the website we’ll be testing. This is a dummy application/API for crocodiles owners to use who want to keep track of their crocodiles. In the test, we’ll create a user; query some crocodiles; and create, update, and delete a crocodile.

Cloning and Running the Tests
Clone the sample framework using the following command:
git clone https://github.com/go-automate/k6-typescript-framework.gitThen, open the framework in your favorite IDE, and install all of the framework dependencies by running:
yarn installNow run the following to run your first test:
yarn go:k6The output should look like this:

Everything should pass (unless your network is very slow). For more information about this output, see the k6 documentation.
To run your script with monitoring switched on, first start the InfluxDB and Grafana Dockers:
yarn monitorsNote: If you’re running in Windows, you’ll have to use the full paths in the volumes sections of the docker-compose.yaml file and implement some workarounds. See the k6 documentation for more detail.
Go to localhost:3000 in your browser to log into Grafana with the username admin and the password admin.
Add the k6 dashboard to Grafana by following these instructions to import a dashboard (please note: it’s much better to create your own than to use a standard one).
Now, run the test using the following command:
yarn go:dockerAnd take a look at the output in Grafana (see below).

This is just the tip of the iceberg of what k6 can do. There’s plenty more information in the README.md of the repository and in the k6 official documentation.
Finally, the example TypeScript k6 framework has a lot thrown in, including the kitchen sink, so I’d recommend building a simple framework in JavaScript first using the official k6 documentation and this example. This will help to get your head around how k6 really works. Then return to this article and Git repository.
I hope this has been helpful — happy performance testing!
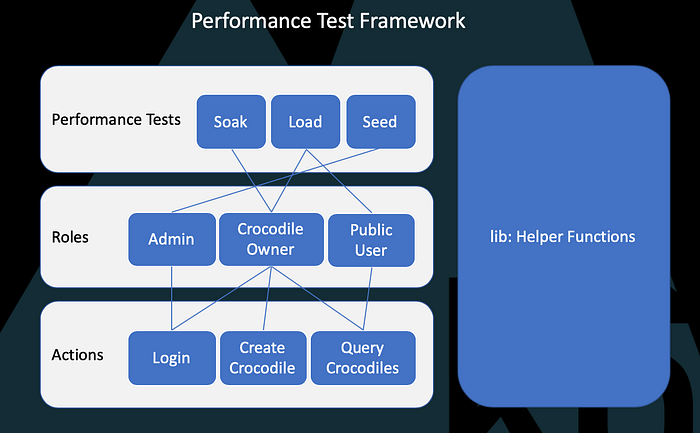
P.S. I forgot to mention how modular k6 frameworks are, allowing for lots of code reuse — as you can see from the architecture diagram below (taken from the TypeScript example).

