Pandas, Spark, and Polars — When To Use Which?
When working with data, big or small, it’s important to understand what’s happening under the hood, especially if you place the code in the cloud, pay for the compute, or share resources with other systems and µServices.
Let’s look at the advantages and disadvantages of three popular packages that handle tabular data.
Here’s the link to the Git Repo.
If you want to read about this test's container aspect, hop on to this link.
Pandas Background

In 2008, Wes McKinney created Pandas. It’s one of the most popular Python packages for data analysis and is written in C.
By default, it uses a single CPU core to process data.
Polars Background

In 2020, Ritchie Vink created Polars. It is similar to Pandas but performs better when processing large-scale data. Polars is written in Rust.
By default, Polars uses all the available CPU cores on the system for processing data.
Spark Background

In 2010, Matei Zaharia created Spark. It was designed to run on distributed computing clusters, and its processing model is based on parallel computing. Spark is written in Scala.
By default, Spark uses all the available CPU cores in the cluster for processing data.
What Happens in the Code?
Here’s a link to the Git Repo.
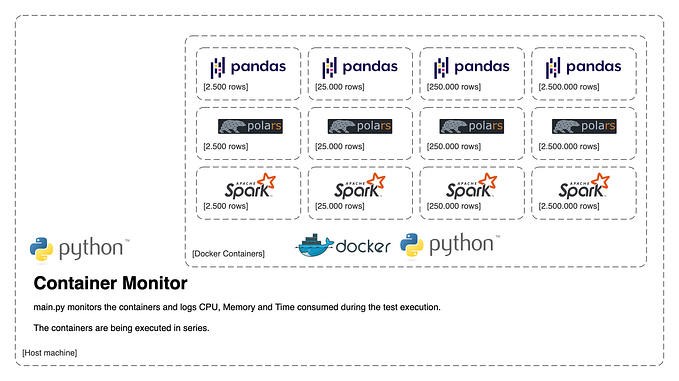
Main code (main.py) controls 12 containers altogether. The containers are executed in series with environmental variables stating what package and dataframe size to use.
The test will be executed with dataframe sizes of 2,500, 25,000, 250,000, and 2,500,000 rows.
The main code also runs a separate thread that monitors each container's CPU, memory, and time consumption; it logs that to a JSON file when each container has finalized the testing.

These are the package version this test was created with:
pyspark==3.3.2
pandas==2.0.0
polars==0.17.1
The test was executed on the system:
macOS Monterey
CPU : Apple M1 (8cores)
Memory : 8 GB LPDDR4
HDD : 256 SSD APPLE SSD AP0256Q
What data is used in the dataframe?
The test generates random data in a dictionary, and this is used to create the dataframes.
def mockedDict():
    #Generate a list of unique ID's
    uniqueIdList = []
    for n in range(1,cardinality):
        uniqueIdList.append("machine"+str(n))
    #Generate mocked data
    idList = []
    valueAList = []
    valueBList = []
    valueCList = []
    valueDList = []
    for n in range(0,dataframeN):
        idList.append(random.choice(uniqueIdList))
        valueAList.append(round(random.uniform(40,100), 2))
        valueBList.append(round(random.uniform(40,100), 2))
        valueCList.append(round(random.uniform(40,100), 2))
        valueDList.append(round(random.uniform(40,100), 2))

    data = {
        "id":idList,
        "valueA":valueAList,
        "valueB":valueBList,
        "valueC":valueCList,
        "valueD":valueDList
    }
    return data
What operations are executed?
The following code drives the performance test of each package. It finds unique values in the id column, and in 10,000 iterations, groups and sums the columns' numeric values.
def pandasTest(testDf):
    pandasStartEpoch = int(time.time()*1000)
    idListPandas = list(testDf['id'].unique())
    for n in range(0,calcN):
        groupedPandasDf = testDf.groupby("id").sum()
    pandasEndEpoch = int(time.time()*1000)
    pandasTimeSpent = float((pandasEndEpoch-pandasStartEpoch)/1000)
    return pandasTimeSpent

def polarsTest(testDf):
    polarsStartEpoch = int(time.time()*1000)
    idListPolars = list(testDf['id'].unique())
    for n in range(0,calcN):
        groupedPolarsDf = testDf.groupby("id").sum()
    polarsEndEpoch = int(time.time()*1000)
    polarsTimeSpent = float((polarsEndEpoch-polarsStartEpoch)/1000)
    return polarsTimeSpent

def sparkTest(testDf):
    sparkStartEpoch = int(time.time()*1000)
    idListSpark = testDf.select("id").rdd.flatMap(lambda x: x).collect()
    for n in range(0,calcN):
        groupedSparkDf = testDf.groupBy("id").sum()
    sparkEndEpoch = int(time.time()*1000)
    sparkTimeSpent = float((sparkEndEpoch-sparkStartEpoch)/1000)
    return sparkTimeSpent
Let’s check the result!
So, how did it go? Here’s the visual output for each test:
The test will execute with 50 and 5,000 as cardinality. But what is cardinality? It is the number of unique ids in the dataframe.
2,500 rows


25,000 rows


250,000 rows


2,500,000 rows


Conclusion
For smaller datasets, Polars is a good default choice. If your use case is more interested in limiting CPU usage, use Pandas.
For larger data frames, Spark has the lowest execution time but very high spikes in memory and CPU utilization. Polars’ CPU utilization is kept at a higher level, but memory is lower and more stable. It has a longer execution time than Spark.
In my view, there is no ‘winner.’ It all depends on the use case and what behaviour suits your system.
- Smaller dataframes? Go for Polars.
- Smaller dataframes with capped CPU utilization? Go for Pandas.
- Only working with large dataframes that require distributed compute? Go for Spark.
- Predictable memory and CPU usage with good performance for smaller and larger dataframes? Go for Polars.
Happy coding!