Palantir Foundry — The Data Operating System That is Not Talked About Enough

Foundry
The world of data engineering is full of debates, with different schools of thought vying for supremacy. There are a lot of discussions around data modeling, e.g., Inmon vs. Kimball, but also around tooling, whether Fivetran + DBT are rent-seeking, or the everlasting debate of Snowflake vs. Databricks. Today I want to shed some light on a tool I have rarely seen discussed in any LinkedIn posts, Medium articles, or HackerNews threads.
That tool is Palantir Foundry. Some might have heard of it already, but what exactly is Foundry? While Palantir is primarily known for its work with the government, they also have a commercial offering, Foundry the Data Operating System. First and foremost, it is designed to be a complete end-to-end data platform, a mesh of services containing everything you need to manage your data, from ingestion to transformation, storage, visualization, and Machine Learning. But that is only the tip of the iceberg.
Foundry takes a radically different approach to traditional cataloging and schema design, focusing on semantics and kinetics. You create an Ontology, defining objects, their properties, and the links between them. It connects your data to the real world, serving as a digital twin and as a shared language between all the stakeholders of an organization. This enables, e.g., business users to build applications on top of the Ontology to fully operationalize the data without thinking of data as data frames but as real-world objects.
The Ontology is such a groundbreaking concept that it could be the subject of an article on its own. However, in this article, I want to highlight three features that make Palantir Foundry stand out to me.
Disclaimer
Before we dive into the features of Palantir Foundry, it’s important to note that I have yet to personally use Foundry. My knowledge is based on conversations with users, videos, and documentation.
It’s also worth mentioning that there are valid reasons why Palantir Foundry is talked about less than other data platforms. For one, it’s not an off-the-shelf SaaS product with pay-per-use pricing. Instead, it requires expensive licenses that may be out of reach for some organizations. Additionally, Palantir hasn’t always been transparent about its product capabilities, although this is changing as they continue to improve its documentation and communication with users.
With that said, let’s take a closer look at three unique features of Palantir Foundry.
Treating Data Like Code
Software developers often utilize version control systems to coordinate their work on a codebase. This allows multiple engineers to safely contribute to the same codebase without interfering with each other’s work. Foundry approaches data in a similar way that software developers approach code. It enables many individuals to interact with the same data and make changes without disrupting others’ progress using branching. It allows you to diverge from the main path and work on data within your branch. After making desired changes, you can merge your branch back into the main branch once you are satisfied with the results.
Let us imagine you are working on a feature branch and want to commit a change to the main branch, e.g., rename a column in a Spark Job. You can use the Compare feature of Foundry to compare the output dataset on the feature branch to the dataset on your main branch. The comparison includes a lot of helpful dataset stats, like size, file count, and row count. You can even compare on column level, looking at the percentage of NULL values, Min/Max, or Mean. This allows you to ensure that your changes are purely metadata related in this use case.
If you are sure your changes are ready to be merged, you create a pull request showing you many helpful things. Firstly you can see, as you are used to, the files that have been changed by the commit. But now the magic begins! Foundry will provide an impact analysis showing you the affected datasets, their schema changes, and whether the affected datasets pass pre-defined health checks.

But there is more! Since Foundry captures the lineage of each dataset, there is a pipeline review for each pull request, visualizing the changes made to the pipeline.
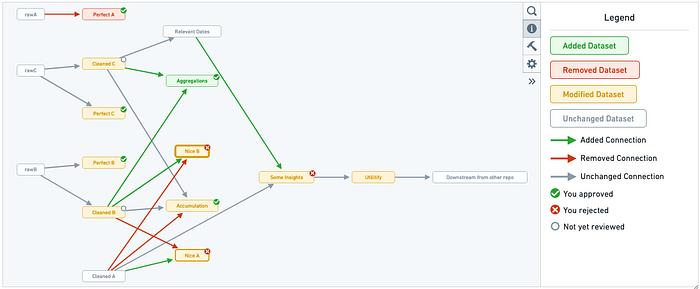
Those features not only help people working on the pipelines but also people that are reviewing pull requests, helping them to make sure that no unexpected changes occur.
Typescript functions with pre-generated types
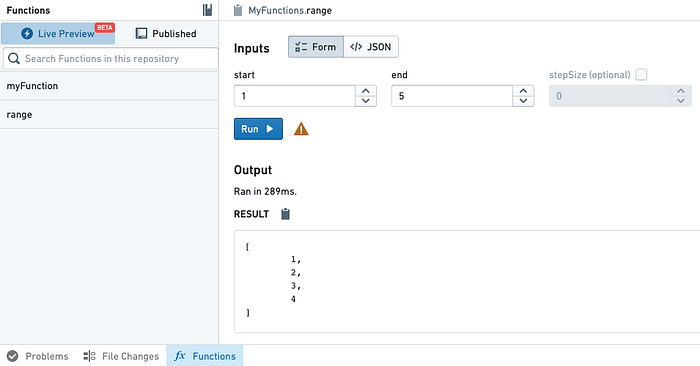
Foundry provides a service called Foundry Functions that enables users to interact with objects from the ontology via a TypeScript AWS Lambda-like function.
One of the critical benefits of Foundry Functions is that it generates interfaces for objects imported from the Ontology. This makes it easy to interact with those objects by accessing their properties, traversing links between them, or aggregating collections. Typical use cases are:
- Custom aggregations for dashboards.
- The calculation of custom metrics.
- Even complex edits to the Ontology itself.
You can reuse functions across multiple services, such as Foundry Workshop, which allows users to build no-code applications.
Besides running unit tests automatically on commit, it also provides a live preview tab that allows users to test their functions in real time, making the development process iterative and easy.
Foundry Functions brings collaboration in an enterprise to a whole new level. It allows regular Software Engineers to work directly on the data provided by Data Engineers without thinking about columns and rows in a table.
Quiver’s Graph
Quiver is a service that provides advanced analytical and dashboarding capabilities on top of your Ontology. You can build dashboards that can be shared across your organization or even embedded in other services. It is similar to products like Tableau or PowerBI.
One feature that makes it stand out to me is its two modes.
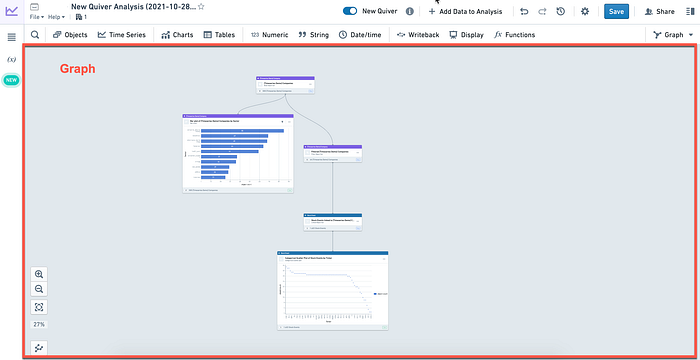
First is the canvas mode, which is very familiar to people that have already used traditional BI tools, which provides an empty view you can fill with visuals. Then there is Graph Mode, where it’s getting interesting.
Let us imagine you are inheriting the ownership of a dashboard, and the creator has already left the company. The dashboard displays some numbers and KPIs, and you are tasked with changing some. Here is where Graph mode comes into play. It provides a dependency graph of your analyses, showing the lineage of every visual contained, allowing the user to understand why a specific visual shows data. I’ve certainly been in such a situation, and I can not stress enough how handy this feature would have been.
Conclusion
Foundry is a vast product, and there is lots and lots to talk about. I hope you enjoyed the article and found the features as exciting and unique as I do.