Optimizing Node.js Performance: Detecting Memory Leaks and High CPU Usage
Eliminating memory leaks and high CPU usage for faster node applications
Introduction
Node.js is a popular JavaScript runtime known for its speed, performance, and scalability. However, even the most optimized and well-written Node.js applications can suffer from performance problems, such as memory leaks and high CPU usage. Profiling is a crucial process that helps identify and resolve these performance bottlenecks. In this tutorial, we will cover the best practices and tools for profiling Node.js applications, including how to detect memory leaks and high CPU usage.
Why Profiling Is Important
Profiling Node.js is important. It helps you understand how your application uses resources such as CPU, memory, and I/O and identify performance bottlenecks. Profiling provides valuable information that can be used to optimize your application, reducing the time it takes to complete tasks, reducing memory usage, and improving overall responsiveness.
- Optimize performance — Profiling helps identify performance bottlenecks in your application, such as slow response times and high CPU usage. By resolving these bottlenecks, you can improve the overall performance of your application.
- Improve stability — Profiling helps you identify stability issues in your application, such as memory leaks. By resolving these issues, you can improve the overall stability of your application.
- Save resources — Profiling helps you identify resource usage in your application, such as memory and CPU usage. By reducing resource usage, you can save on costs and improve the scalability of your application.
Tools That Can Be Used
Chrome DevTools
The Chrome DevTools is a powerful debugging and profiling tool for Node.js applications. They provide a wealth of information about your application, including memory usage, CPU usage, request count, response time, and more. To access the Chrome DevTools, you can use the command-line interface by typing the command node --inspect in your terminal.
Node Inspector
The Node Inspector is a powerful debugging and profiling tool for Node.js applications. It provides a graphical user interface that makes it easy to monitor your application, including memory usage, CPU usage, request count, response time, and more. To use the Node Inspector, you can install it as an npm package by typing the command npm install -g node-inspector in your terminal.
node-memwatch
is a Node.js module that helps track memory usage and detect memory leaks in Node.js applications. It provides an API for monitoring the heap size, heap usage, and the number of objects in a heap, as well as for tracking GC (Garbage Collection) statistics. It also provides tools for detecting memory leaks and generating heap snapshots, which can be used to identify the cause of memory issues.
memwatch.on('leak', function(info) { ... });The info object will look something like this:
{ start: Fri, 29 Jun 2012 14:12:13 GMT,
  end: Fri, 29 Jun 2012 14:12:33 GMT,
  growth: 67984,
  reason: 'heap growth over 5 consecutive GCs (20s) - 11.67 mb/hr' }
v8-profiler
is an npm library for profiling Node.js applications. It provides an API for profiling JavaScript code running within the Node.js runtime using the V8 JavaScript engine’s built-in profiler. The profiler collects information about the execution of JavaScript code, such as function call counts, function timing, and memory usage, which can be analyzed to identify performance bottlenecks and memory leaks in an application.
The library allows you to start and stop profiling sessions, take snapshots of the heap and profile data, and generate reports of the profile data in a human-readable format. The profile data can also be saved to a file and loaded into a visualization tool for further analysis.
const express = require('express');
const v8Profiler = require('v8-profiler');
const path = require('path');
const fs = require('fs');

const app = express();
const snapshots = new Map();

// API endpoint for taking a heap snapshot
app.get('/api/heap-snapshot', (req, res) => {
  const snapshot = v8Profiler.takeSnapshot();
  const name = snapshot.getHeader().title;
  snapshots.set(name, snapshot);

  res.send({ name });
});

// API endpoint for downloading a heap snapshot by name
app.get('/api/heap-snapshot/:name', (req, res) => {
  const name = req.params.name;
  const snapshot = snapshots.get(name);
  if (!snapshot) {
    return res.status(404).send({ error: 'Snapshot not found' });
  }

  const fileName = `${name}.heapsnapshot`;
  const filePath = path.resolve(__dirname, 'snapshots', fileName);
  snapshot.serialize(
    { write: chunk => fs.appendFileSync(filePath, chunk) },
    () => {
      res.download(filePath, fileName, error => {
        if (error) {
          console.error(error);
        }
        snapshots.delete(name);
      });
    }
  );
});

// Start the Express server
const port = process.env.PORT || 3000;
app.listen(port, () => {
  console.log(`Server listening on port ${port}`);
});
Examples
Memory leak
The following code creates a simple HTTP server that listens on port 3000.
The setInterval function creates a new array with a large amount of data and pushes it to the data array each second. The problem is that the data is never released from memory, leading to a continuous increase in memory usage, known as a memory leak. Over time, the application's memory usage will increase until it eventually crashes due to running out of memory. To fix this memory leak, you would need to remove the unused data from memory, for example, by setting data = [] when it's no longer needed or by evicting the oldest entries from the array.
const express = require("express");
const app = express();
let data = [];

app.get("/leak", (req, res) => {
  setInterval(() => {
    data.push(new Array(1000000).join("a"));
  }, 1000);
  res.send("Memory leak started!");
});

app.listen(3000, () => {
  console.log("Server started on port 3000");
});
To detect the memory leak, we can use the Chrome DevTools by typing the command node --inspect in our terminal. Once the Chrome DevTools are open, we can navigate to the “Memory” tab and select “Take Heap Snapshot.” This will give us a snapshot of the memory usage, then. We can then compare this snapshot to later snapshots to see if there is any increase in memory usage over time.
The objective is to compare two heap snapshots taken at different points in time to see which objects are accumulating in memory. This allows you to see which objects are not being garbage collected and determine if a memory leak is occurring.

The important thing is to compare heap snapshots taken at different points in time to determine if a memory leak is occurring. When comparing heap snapshots, you should look for objects increasing in size or count between snapshots. You should also look at the reference graph of each object to determine why it is not being garbage collected. In many cases, a circular reference between objects can cause a memory leak, as the objects cannot be garbage collected because they are still referenced by other objects.
- Shallow size: This is the size of an object in memory, including the memory occupied by its properties and the size of any values stored in those properties.
- Retained size: This is the total memory that would be freed if the object was garbage collected, including not only the shallow size of the object itself but also the shallow size of all objects referenced by the object, even if they are not directly referenced from other parts of the code.
In other words, the retained size of an object is the sum of its shallow size and the shallow sizes of all objects that cannot be garbage collected because the object references them. This measurement can help you identify objects that are taking up a large amount of memory, even if they don’t have a large shallow size themselves.
High CPU usage
This code creates an endpoint /high-cpu that executes a function highCPUFunction that performs a loop with 10M iterations. The time it takes to complete the loop is calculated and logged to the console.
This computationally intensive operation can cause high CPU usage, as the CPU will be working hard to perform the calculations in the loop. The amount of CPU usage will depend on factors such as the processing power of the CPU and the available system resources.
const express = require("express");
const app = express();
function highCPUFunction() {
let sum = 0;
for (let i = 0; i < 10000000; i++) {
sum += Math.pow(Math.sin(i), i);
}
return sum;
}
app.get("/high-cpu", (req, res) => {
const start = Date.now();
// Perform a computationally intensive operation
const result = highCPUFunction();
const end = Date.now();
console.log(`Computation took ${end - start}ms`);
res.send(result);
});
app.listen(3000, () => {
console.log("Server started on port 3000");
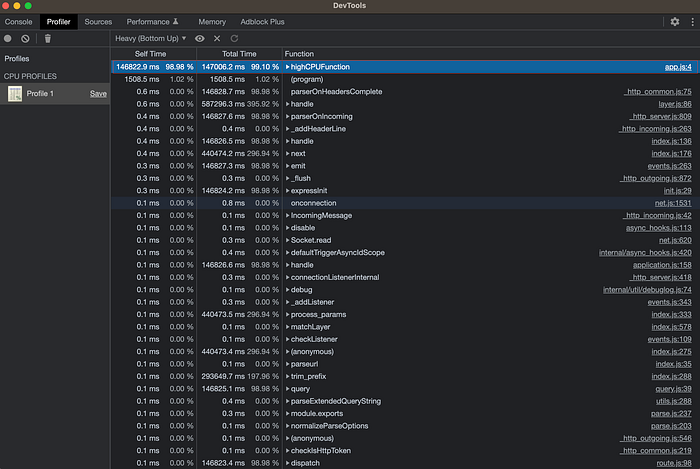
});To detect high CPU usage, we can use the Node.js Built-in Process Manager by typing the command node --inspect in our terminal. Once the process manager is open, we can navigate to the “Performance” tab and select “Start profiling.” Once profiling is started, we can call the http://localhost:3000/high-cpu API, This will start profiling the application and give us a detailed view of the CPU usage, including which functions use the most CPU time.
Conclusion
Profiling is an important process for optimizing the performance, stability, and scalability of Node.js applications. By using tools such as the Node.js Built-in Process Manager, Chrome DevTools, Node Inspector, and other tools, you can easily monitor and resolve performance issues such as memory leaks and high CPU usage. By following the examples and best practices outlined in this article, you can improve the overall performance of your Node.js applications and provide a better user experience.

