Optimize Python Code With Scalene and AI Suggestions
Make your code faster and reduce memory usage with the Scalene profiler

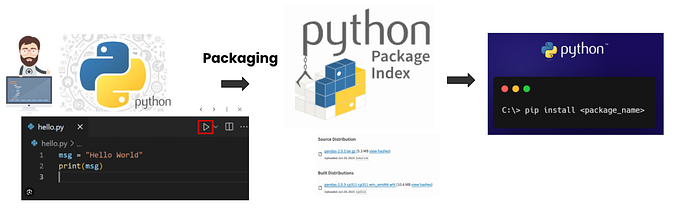
Python is often used with libraries written in other languages behind the scenes. With this level of abstraction, it can be complicated to figure out how to improve performance and memory usage. However, these issues can be solved using a profiler.
A profiler aims to find which code sections take the longest or use the most memory. Scalene is a great Python profiler that targets CPU, GPU, and memory. If combined with AI suggestions, Scalene helps you refactor the problematic sections faster for high-level performance.
How To Use Scalene
To run Scalene, use the command scalene program_name.py. It profiles both CPU, GPU, and memory by default. If you only want one or some of the options, use the flags --cpu, --gpu, and --memory. For example, scalene --cpu --gpu program_name.py profiles only CPU and GPU.
Besides line-level profiling, Scalene also provides function-level profiling. The two types of profiling are kept in separate sections of the output table. The first section includes the line-level profiling of all lines, while the second section includes the function-level profiling of all functions. To profile only the lines and functions with significant usage, add the flag --reduced-profile.
Interfaces
After running the profiling command, it shows the results on an interface. You have two interface options: the Command Line Interface (CLI) and the web interface. To compare them, we will be using the following Python file called test.py.
size = 1000000

# High memory allocation
x = [i for i in range(size)]
y = [i for i in range(size)]

# High computation time
for i in range(size):
    y[i] = y[i] * y[i]
Command line interface
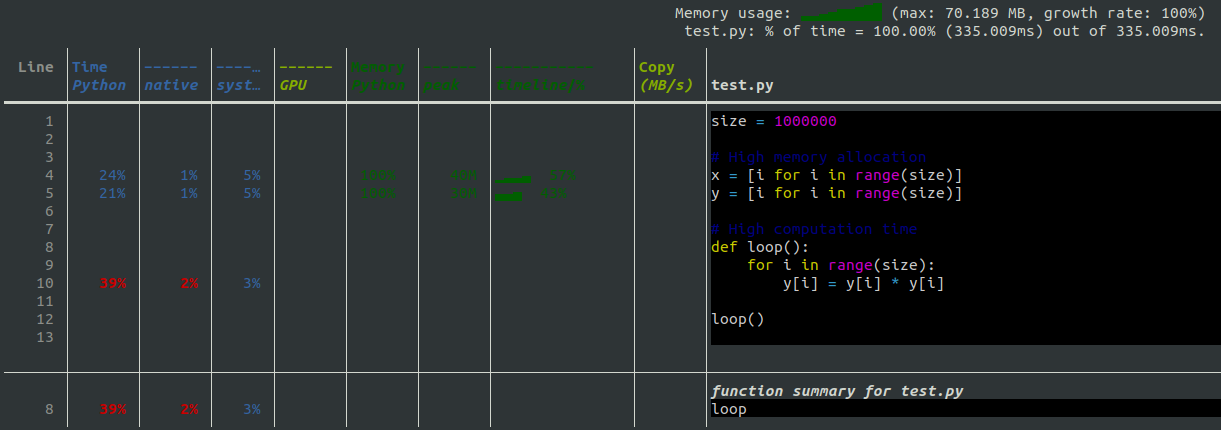
By default, the command scalene test.py will open the web interface. To obtain the CLI instead, add the flag --cli.
In the table, we have three colors present. Blue indicates CPU profiling, green indicates memory profiling, and yellow indicates GPU profiling and copy volume.
CPU profiling gives the time spent running Python code, native code (for example, C or C++), and time spent on the system (for example I/O). In the example, 45% of the total running time is spent on Python code on the line y[i] = y[i] * y[i]. As such, this is one of the lines that we must optimize to increase performance. If you sum all the percentages in the blue columns, you get 100%.
Memory profiling gives the percentage of the memory allocated by Python code. The table also includes the memory usage over time and its peak. As expected, the creation of the x and y vectors lead to the highest memory allocation. To improve performance, we must create them with more efficient allocation functions.
GPU profiling and copy volume give the GPU running time and volume of copying (mb/s), respectively. The copy volume includes copies between GPU and CPU. To note, GPU profiling only supports NVIDIA GPUs.
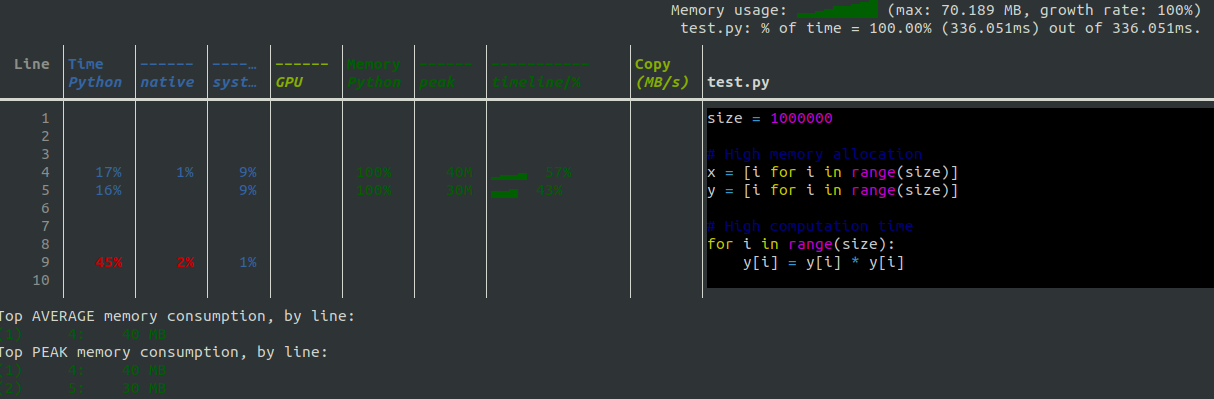
Web interface

The web interface is quite similar to the CLI. However, some columns are compacted using color shades. For example, we only have a column in blue (for CPU profiling) with three shades representing Python, native, and system time.
Memory and GPU profiling have extra columns. Memory profiling has an extra column indicating the average memory usage. The memory activity shows the memory allocated by Python and native code, differentiated by two shades of green. GPU profiling has an extra column indicating GPU memory usage.
Unlike the CLI, extra files are created called profile.html and profile.json, which include the results shown. If you wish to obtain these with the CLI, use the flags --json and --html .
AI Suggestions
So far, the tools at our disposal have helped us determine which lines and functions to improve. However, we can make our work even faster by generating AI suggestions instead of coming up with them ourselves. Fortunately, Scalene can be used with OpenAI, given an API key.
To get an API key, first sign in to your OpenAI account or create one. Then, click Personal on the top right corner of the screen and choose View API keys . On that page, you can generate a new API key and then copy it to the Scalene web interface on advanced options.
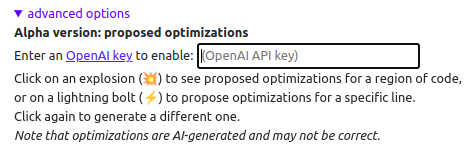
There are two types of suggestions you can choose from. The explosion symbol 💥 gives optimizations for an entire region of code, while the lightning bolt ⚡ proposes only for a line. In the following image, you can see the lightning bolt suggestions for test.py, which mostly include replacements using NumPy.

The optimized version of test.py becomes:
import numpy as np

size = 1000000

x = np.arange(size)
y = np.arange(size)

y = y ** 2
Resources
- Scalene paper: https://arxiv.org/pdf/2212.07597.pdf
- Scalene GitHub repository: https://github.com/plasma-umass/scalene
- OpenAI API website: https://openai.com/api/