How To Keep Your Website Monitoring Simple and Great
3 monitoring techniques you should consider
Monitoring an application is something about which countless books have been written and rewritten. I’ve personally worked as an enterprise-level software consultant where we monitored everything. Earlier this year, however, I switched to a startup where there was no monitoring except for some sanity checks done after each deployment. That startup has more than 100k active users per month and only now have they started to think about monitoring.
So what’s the right way to go? Should we spend all our time monitoring our monitoring tools, or should we just stop monitoring altogether? What should we monitor and how can we keep our team interested and involved?
What Is Monitoring?
“Monitoring is the process of testing and verifying that end-users can interact with a website or web application as expected.” — Wikipedia
This means that our monitoring tools should be able to alert us if this is not the case. Monitoring exists in all forms and shapes — an email you receive if your disk volume is almost maxed out on your server, a Slack notification when a user cannot log in, etc. — all with the ultimate goal of ensuring that a website is available to users and that any kind of downtime is minimized by activating developers to investigate the problem.
If you’ve configured a monitoring system before, you’ll know how hard it is to keep the team involved and interested in a Slack channel in which an alert is posted every 30 minutes. Effectively filtering out some of these alerts isn’t always possible.
For example, think about exceptions. Sometimes we want exceptions to be thrown in a way that allows us to gather information about a certain piece of code. Or sometimes we use libraries that throw exceptions over which we don’t have any control. Should we start using a tool that can filter those exceptions before we send it to Teams or Slack? Maybe an Azure logic app with some complex logic that is only understood by one team member? What if the logic app fails? Do we need monitoring to ensure that our monitoring works?
Down the rabbit hole you go, and before you know it, you have five different dashboards with all kinds of statistics no one in the team is looking seriously at anymore. Will you know if your application is impacted?
How Can We Solve This Problem?
I’d like to summarize a few points which I believe make up the most important aspects of a monitoring system:
- A user flow may never be impacted.
- Only the most important alerts should appear in our communication channel (e.g. the user isn’t able to log in anymore).
- A weekly report can help us monitor the state of the application.
- Someone should be responsible for ensuring uptime.
I believe that’s monitoring for most websites/applications out there. Remember that user flows are the most sacred thing in our applications. Once those are impacted, that’s when alarm bells should be ringing. If only the most important alerts are posted in a Slack channel, then of course everyone will be interested to ensure that the problem is resolved as soon as possible.
1. Set up UI tests that can run periodically
How do we ensure that a user is not impacted? By mimicking their behavior.
We can do this by combining API tests and UI tests. These tests can be managed by us or can be hosted on an online SAAS platform that has connections to our CI tools and communication channels out of the box.
Writing our UI tests
Writing our UI tests has downsides and upsides. A downside is that they will always have to be created by someone with coding knowledge and may need quite some infrastructural work. An upside is that they offer a lot of flexibility as we’re able to take advantage of many libraries out there.
We can also use things like Headless Recorder to record a browser session and generate code for us so that we can quickly create new flows and not be bothered by all the technicality and overhead of setting custom selectors.
Although there are quite a few out there, I would like to discuss two of them because they are directly supported by Headless Recorder.
Puppeteer is a Node.js library developed by the Chrome DevTools team. It allows for easy testing, as Puppeteer talks to the browser using the DevTools protocol. This is great because it allows us to intercept network requests which are a nice-to-have to get to the root cause of why something is going wrong. Using a library like Jest, we can then start testing specific flows.
Playwright is a Node.js library developed by Microsoft. The API is very similar to the one of Puppeteer and both make good candidates for you to write UI tests. You can use Jest Playwright to quickly start coding user flows.
Make sure you group your tests in a way that makes sense so that all developers know where to add new or look for existing tests.
Using a SAAS tool
Another possibility is using SAAS tools. Here too, I’ll just be looking at three of them that caught my eye. There are many more, and with some research, you might find a more suitable one for your use case. All of them allow you to schedule test runs and alert your team if something goes wrong.
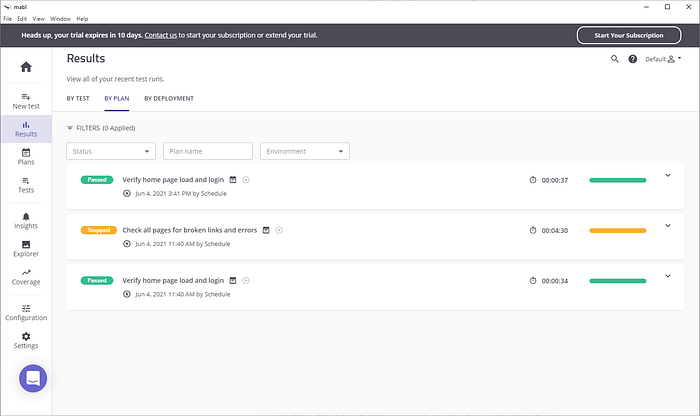
Mabl is a desktop app that allows your whole team to create tests by recording intended behavior and adding “assertions” along the way (without programming knowledge). It allows for testing your website on multiple devices and includes many nice features that make this a good candidate in my book.
I wish they were more transparent about pricing as they force you to meet with a sales rep to get pricing information.
Positive:
- Mailbox per test run to test emails (!)
- Environments allow splitting for multiple platforms
- Integration with a lot of CI tools and communication channels
Negative
- Imprecise targeting for assertions. I selected a div and it asserts that it is on the page by checking the inner text.
- No pricing info
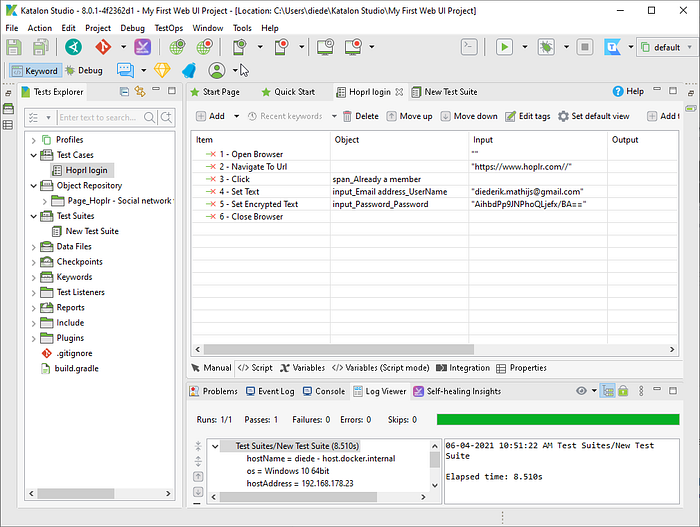
Katalon is one of the competitors of Mabl, and in a certain way, they are very similar. It also works as a desktop app and has lots of integrations with CI tools and communication channels.
It also claims to have native app testing (Android/iOS) using Appium. However, I couldn’t get it working, and there seemed to be little community activity to warrant that I would solve the problem easily.
A great thing about Katalon is that, unlike Mabl, you have full control of the selectors on the page. You can overwrite the selectors for things you’ve clicked during the recording of a session by using what they call the Web Object Spy.
Positive:
- Lots of options to customize test runs
- Integration with CI and messaging platform
- Nice product tour
- Everything is in Git
- Free for most things
Negative:
- Old and sometimes confusing interface
- Doesn’t have an email inbox for tests
- Quite a lot of work to add manual assertions
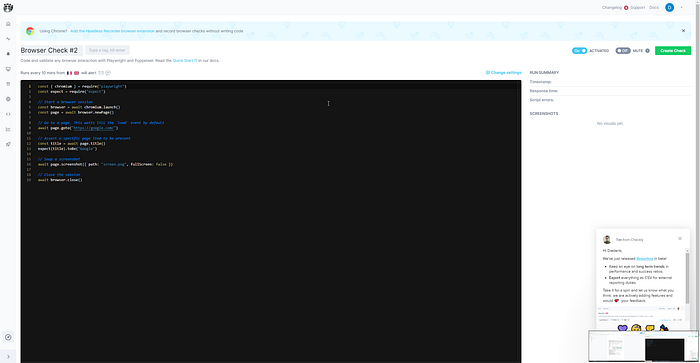
Checkly is different from both tools mentioned above. It’s fully online, and you use Headless Recorder to record a flow on your website. This recorder will generate a script that you can then paste into Checkly and that will allow you to re-run the flow by calling it using a webhook or GitHub.
Its simplicity is what I love, and it’s why I chose to implement Checkly for us. It’s important to note that they might get pricey if your application has a lot of flows.
Positive:
- Customize test-run location, group tests
- Fine-grained alerting to most channels
- Free up to 50k API checks and 5k browser checks per month
Negative:
- Only native integration with GitHub
- Can get pricey easily
All of these before-mentioned tools and libraries allow you to quickly build a whole library of test flows that can be executed by the click of a button. New tests can also easily be added by people without any programming knowledge — how cool is that?
Scheduling the execution
Once you’ve written your whole test suite, it will be important to think about how many times per day you want to run all of these tests. Will you run them every five minutes or every half hour? Everything depends on the cost and importance of the tests. It’s a choice you and your team will have to make to get optimal results and a feeling of safety.
You can use your default CI platforms, like Azure DevOps, GitLab, GitHub, or CircleCI, to schedule these test suites. If your team has chosen one of the SAAS tools, you’ll get the possibility to schedule test runs within the tools themselves.
2. Configure alerts to show up in the most-used communication channel
Once our tests are running, it’s time to make sure that we pick up when things hit the fan. Luckily for us, other developers have made sure that our existing CI tools nicely integrate with communication channels.
If you’re using the self-written tests, you’ll probably use a scheduled pipeline to run through them every x minutes. Azure DevOps, GitHub, and GitLab all offer alerting out of the box. If a runner encountered a failing test, it would be able to alert your Slack or Teams channel.
If you’re using a SAAS tool, you’ll be able to use one of their connectors to make sure that you don’t miss any of the alerts.
The great thing is that if we’re only using these UI tests to notify our team, we know that every single alert is of the utmost importance and should be treated as such. If we had added other alerts based on exceptions, for example, our team would lose interest in the channel quite fast as exceptions can often be fixed with less urgency.
3. Generate lower-priority monitoring digests for the team
Does the fact that we’re testing flows mean that we shouldn’t be aware of what else is happening in our application? Of course not!
Currently, we’re piloting something called a “weekly digest” in our team. It contains two things: functional numbers (like how many emails we sent out, how many users logged in/registered, and how many notifications were sent out) and technical numbers (like CPU levels during the past week or the number of crashes of our iOS app).
These allow us to get an overall sense of how our application is doing. These are interesting as they might lead to new insights about our application, e.g., slow response times on certain routes.
We use the information we capture in Azures’ Application Insight, Firebase, Mandrill, and Twilio. Combine all these sources in a summary, compare these to the previous week, and you’ll get something much more valuable than a dashboard that captures a moment in time
Conclusion
Monitoring is not an easy task. We need to ensure that our users can always access our service without any major problems. In this article, we’ve discussed how keeping monitoring easy and mimicking user behavior can give us the best insights into the state of our platform.
I want to close by mentioning that this article doesn’t cover all use cases. Always think critically about your application, and try to keep things as simple as possible. Good luck!