Mastering GDB
Power up your debugging skills
The GNU Project debugger (GDB) is a very useful debugger under Linux.
Smart programmers usually use gdb to debug bugs, when a program core dumps, or a program occurs unexpected behaviors. In this article, I will show you how to use gdb efficiently.
Choose appropriate compile flags
Compilers often make many optimizations in order to generate optimal code, which makes debugging difficult. If you encounter errors like symbols not found, you need to open appropriate compile flags for debugging, so that the debugger can get enough information.
- use
-gto let the compiler build debug information into the executable. - use
-ggdb3can make gdb debug macros. - use
-fno-omit-frame-pointerto avoid the compiler optimizing out small functions, so that you can see the full call stack. - use
-0gto let the compiler turn on optimizations that don’t affect debugging.
Start gdb
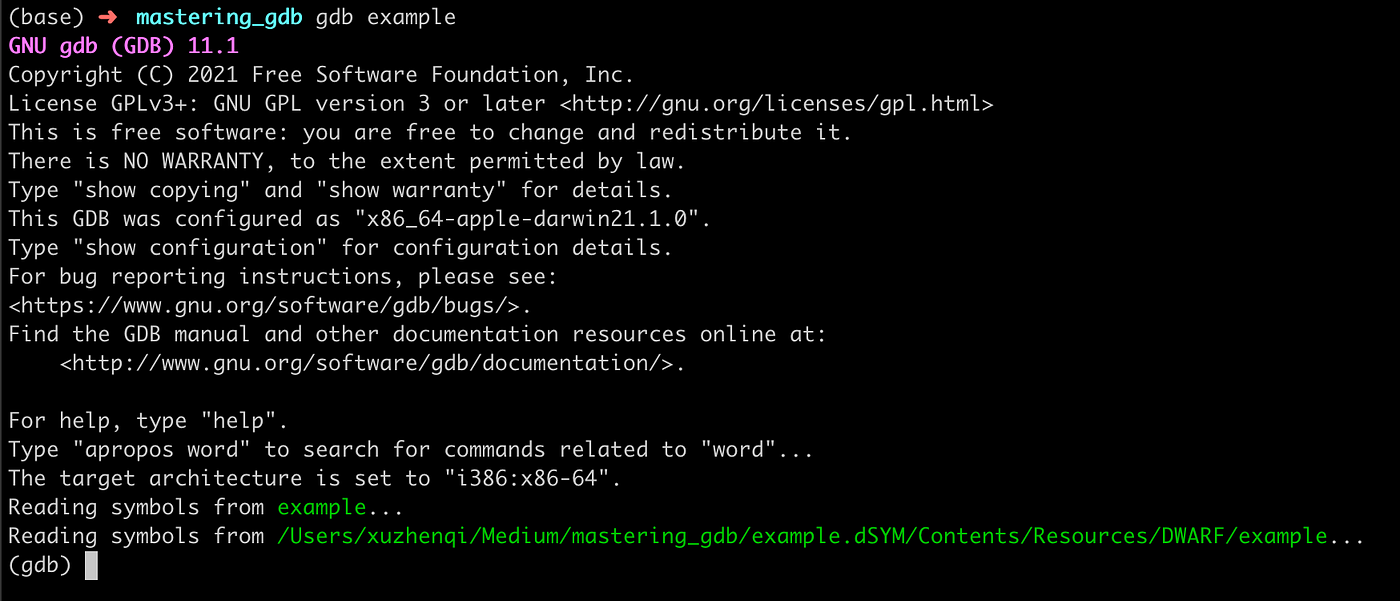
After compiling a program with appropriate flags, we can use GDB to debug the generated executable. There are many different scenarios, and the startup method in each scenario is slightly different.
- In the first scenario, we have an executable that accepts some parameters. We can start gdb with
gdb executable, and then run the program withrun arg1 arg2. - In the second scenario, a core dump file is generated when an executable is running, probably a segment fault. We can start gdb with
gdb executable coredump_fileand gdb will stop at where the error happens. - In the third scenario, we have an executable that is running. We can use
gdb attach pidto attach to the process.
Breakpoints and watches
After starting gdb, we usually set a breakpoint. The program will pause when it hits a checkpoint. And we can observe the status of the program.
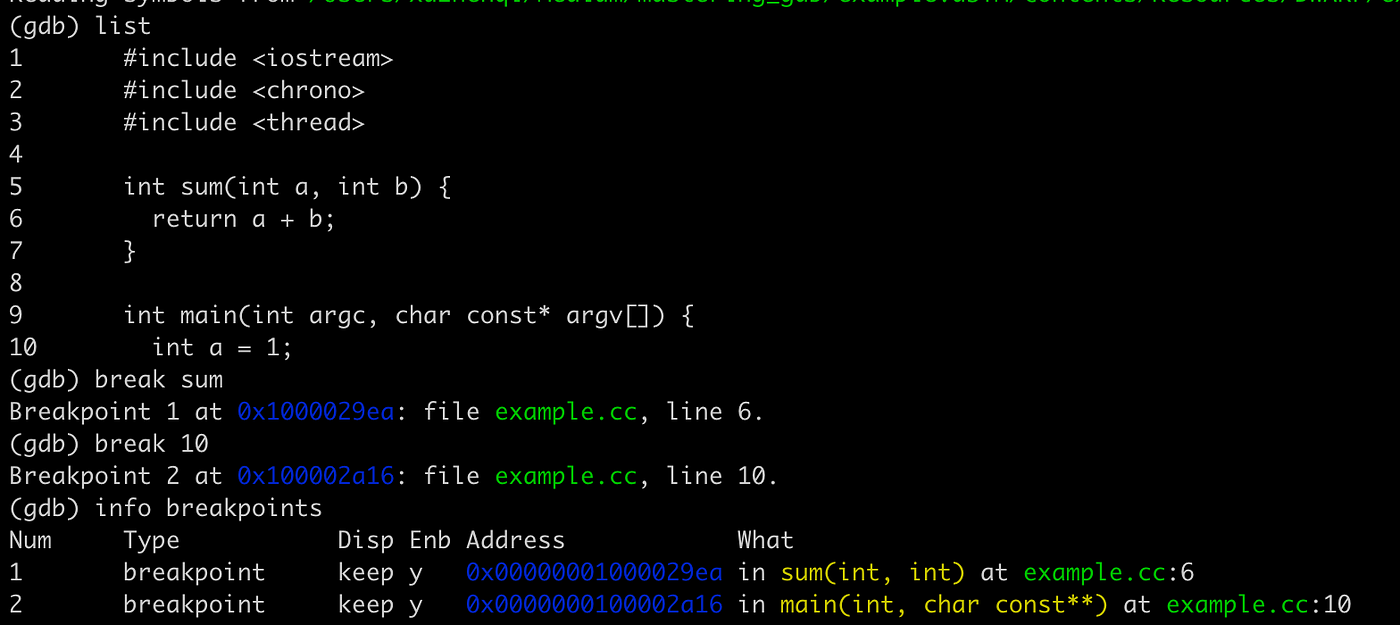
break funcwill break at a function.break example.cc:10will break at line 10 of the example.cc, if there is only one file, we can omit the filename, just usebreak 10. And we can typelistto show the codes around the current line.info breakscan show you all breakpoints you have set.delete 2will delete the second breakpoint.- You can also set conditional breakpoints, just append
if [condition]to break command. watch [variable]can set a watch on a variable, watches are another kind of breakpoint, that will pause the program if the watched variable has changed.
Variables and expressions
When paused on a breakpoint, we can observe the status of the program by printing variables and expressions.
info argscan show us the arguments of a function.info localscan show us the local variables of the current function.printcan be used to show the result of a variable or an expression. See the bellow illustrations.print aprints a variable.print a=2will first evaluatea=2and then print the outcome. Note that if you directly typea=2, you will get an error.print sum(1, a)calls the functionsum.
(gdb) print a
$1 = 1
(gdb) print a=2
$2 = 2
(gdb) print sum(1, a)
You can also format the outcome of print ,
print /x <exp>will show the result in hexadecimal.print /t <exp>will show the result in binary.print /d <exp>will show the result in unsigned int format.print /c <exp>will show the result in signed int format.- Note the outcomes of
print, such as$1,$2, are also variables that can be used further. dprintf locaion, format-string, expr1, expr2.drpintfis a convenient command that can dynamically print at the location, just as you have inserted anprintfexpression at the location.set $foo = 4can set a variable. This is convenient if you want to save some intermediate results.command 2is another gdb command, that you can set commands to be executed when hit the specific breakpoints. The illustration below will executeinfo localsautomatically when the first breakpoints are hit. You can also use this method to achieve the same effects ofdprintf.
(gdb) command 1
Type commands for breakpoint(s) 1, one per line.
End with a line saying just “end”.
>info locals
>end
print *&arr[96]@5can print the 96–100 elements of an array.
Note currently we can not easily print std::vector or other c++ stdlib containers. We will discuss this topic later.
Execution control
There are several commands allowing us to control the execution of the program in the gdb session.
runwill start running the program and stop at the first breakpoint, if there are no breakpoints, the program will stop at the exit.startwill start the program and stop themainfunction.continuewill continue the program and stop at the next breakpoint or exit.finishwill stop when the current function finishes.nextwill stop at the next line.stepwill enter a function and stop there.
Text user interface
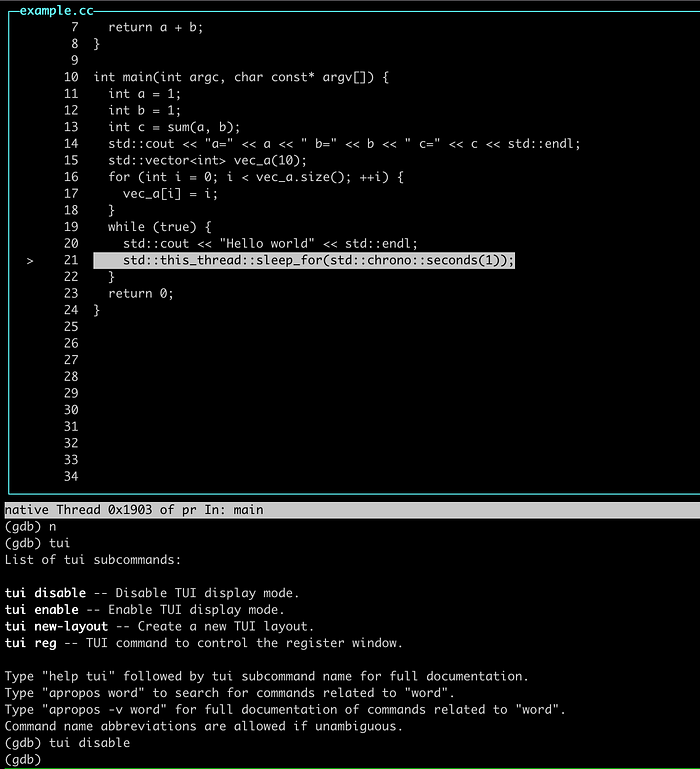
Gdb contains a text user interface (TUI), just like most IDEs, which can display lines of code while debugging. tui enable to enter the tui mode, and tui disable to exit.
Backtrace and threads
Backtrace is useful for debugging, especially when we debug a core dump.
btwill show the current backtrace.upwill move you to the upper frame.downwill move you to the lower frame.frame 2will directly take you to the second frame.
When debugging a multithread program,
info threadsshows all threads.thread 5will go to the fifth thread.thread apply all [command]will execute a command on all threads. It’s very convenient to usethread apply all bt fullto print all backtrace of all threads.
Configuring gdb with .gdbinit
Gdb has a configuration file, located at ~/.gitinit or in the current folder, just like .vimrc for vim . The configuration file in the current path has a higher priority to be loaded than ~/.gitinit . Let’s discuss some configurations.
set logging onwill output all output togdb.txt. This is useful when commands output so much information, like the abovethread apply all bt full.set history save onsaves the command history.set pagination offdisable the interactive display of long screen output.set print pretty oncan display a c++ class with a more pretty format.set confirm offdisable confirmation.
Since gdb can not print c++ containers such as std::vector conveniently, we can write some scripts to make it easy. Follows https://gist.github.com/skyscribe/3978082.
Source file path
Sometimes we encounter errors like xxx.c: No such file or directory . This means that gdb can not find the source file. The solutions are:
- use
directory [folder]to add the specific directory to gdb’s search path. - use
set substitute-path [src] [dst]to substitute path.
Macro expanding
You can also expand macro to see the details after preprocessing.
- use
macro expand some_macro(macro_arg)to expand macro. - use
info macro some_macroto see its definition.
Note gdb will analyze the context of the current function, only macros that are visible in the current context can be expanded.
Record the status of the program
One powerful command of gdb is record , which records the state of the running program, and allows you to back-run the program. Gdb also provides a group of commands starting with reverse prefix, like reverse-continue , reverse-finish , reverse-next , reverse-nexti , reverse-step , reverse-stepi .
One usage of record is to find memory corruption. You can run the program in gdb, record the execution of the program, and stop at the location where memory corruption occurred. Then you can watch the memory address that was corrupted. Then reverse run the program to see where the content of the address has changed.
The drawback of record is that it will slow down your program. It still takes some work to use it well.
Save and load the debug session
Sometimes, you need to adjust the code repeatedly and run the program multiple times to gradually understand the details of the bug. But if you restart gdb every time, it will be inconvenient to set checkpoints repeatedly. We can save the debug session and reload it later.
If you use a makefile to build your program, you can simply type make within the gdb session, it will rebuild your program and reset the checkpoints.
You can also use save breakpoints bp.txt to save the breakpoints to bp.txt, and use source bp.txt to reload these breakpoints later, or use gdb -x bp.txt --args [exe] to load it when gdb starts.
More about debugging
In addition to gdb, there are many other debug methods: such as analyzing logs. Binary search git commits. They have their own advantages and disadvantages. When debugging a program, you can combine these methods to solve the problem efficiently. The advantage is that you have full access to the running program, this is extremely useful when a bug is hard to reproduce.

