Log Monitoring for Critical Log Streams
A look at SIEM management
Log monitoring is not discussed frequently enough. This is likely because most people think it’s simple — just write an alert to see if logs are flowing, right? If that works for your operations, great, but it doesn’t cut it when a security team needs to have true visibility of the attack surface that we have to manage.
I have managed a SIEM (Splunk, Graylog, ELK, etc.) for years, and these are just a few of the logging outages I’ve encountered.
- Partial host logging outage → Only a fraction of the fleet stopped logging
- Rare log streams → A log stream that only outputs once a week hasn’t logged anything in two weeks.
- Log format changes → The logs’ data format changed, so while the logs were still flowing, they weren’t triggering security alerts.
- Latent logs → An issue with time extraction caused the logs to get filtered out by the security alerts.
- Log streams indicating failure → A critical process was repeatedly printing errors, but the logs were arriving in the right format.
- Mass uptick in log quantity → A typo in the application caused logs to balloon to ten times their previous size.
- Upstream aggregator outage → An upstream log collector had an error that caused a log stream to fail.
It often felt like fixing log pipeline errors was like playing whack-a-mole, especially in a large organization that was constantly adding and removing services. In addition, the organization had a geo-distributed workforce that didn’t coordinate closely on new product deployment.
I learned a lot of lessons along the way. These lessons can be separated into two categories: log alerting strategy and log management lessons.
My formula for log alerting (from simple to complex):
- Log existence → Make sure logs are flowing for each index and log type.
- Log latency → Ensure that the last batch of logs received is time-stamped within an appropriate time window.
- Log integrity → Make sure that logs are parseable, have the fields you need and aren’t getting truncated.
- Log bandwidth → Check that the event count or total size of logs hasn’t changed dramatically. This applies to both a drop or growth in logs (anomaly detection).
- Log coverage → Ensure that partial outages are caught by checking that every asset has reported in.
The critical lessons I learned:
- Define a standard log ingestion pattern.
- Remember the importance of asset management.
- Foster collaboration between DevOps and security teams to implement high-fidelity monitoring.
Phases of a Log Pipeline
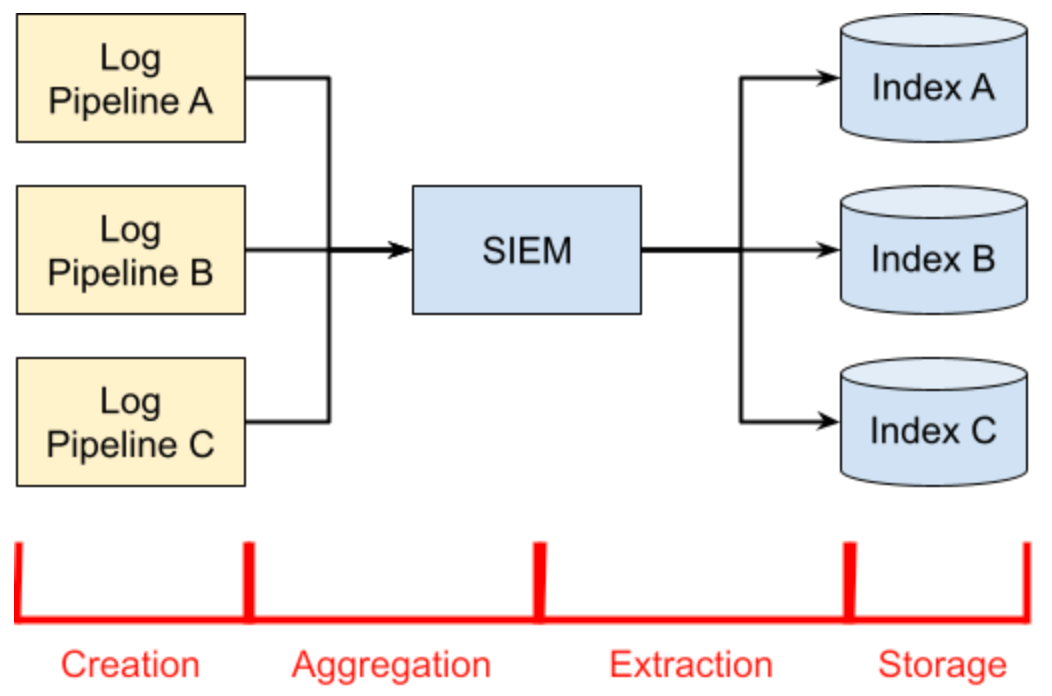
The phases of a pipeline are as follows:
- Creation refers to the generation of the original event.
- Aggregation is the process through which logs are collected, batched, and enriched before they are sent on to the SIEM.
- Extraction is the process that the SIEM uses to turn log data into structured events.
- Storage is the process of taking structured events and putting them into their respective indices.
Everything always fails eventually, which means that a logging outage could occur during any of these phases. Personally, I’ve found it useful to model the logging workflow using these four phases as a way of compartmentalizing the debugging process.
If you are a DevOps engineer in charge of the SIEM, you are usually responsible for extraction and storage. Extraction is usually a series of regexes that turn unstructured logs into structured objects with searchable fields (e.g., extracting the username from a shell command). This part of the pipeline is very brittle to changes made during the creation and aggregation stages. Don’t be surprised if much of your energy is spent on extraction.
Storage becomes complicated at scale. When you are ingesting terabytes of data per day, you will run into scaling issues on many different components. Cost becomes a major factor, as SIEMs can easily balloon into multi-million dollar problems because of both the storage of the logs and the requisite computing required to search the data.
If you are a DevOps engineer on the product, you are usually responsible for creation and aggregation, but not extraction and storage. A common issue during creation is logging too much or too little. Even a simple typo can cause logs to balloon out of control and cause a cascading failure down the rest of the pipeline. Aggregation is sometimes local (e.g., a host process that grabs logs in batches) but can also be done through a logging server (e.g., logbuf, logstash, WEF).
Log Monitoring Formula
Having an accurate and complete set of SIEM logs is essential to the visibility needed by the security team. If the security team lacks visibility, the security of the entire system is in jeopardy. Thus, extra effort needs to be put into monitoring these logs. I recommend building a set of alerts to cover all four of the following: existence, latency, integrity, bandwidth, and coverage.
The following sections go into deeper detail on each one of these.
Log monitoring: existence
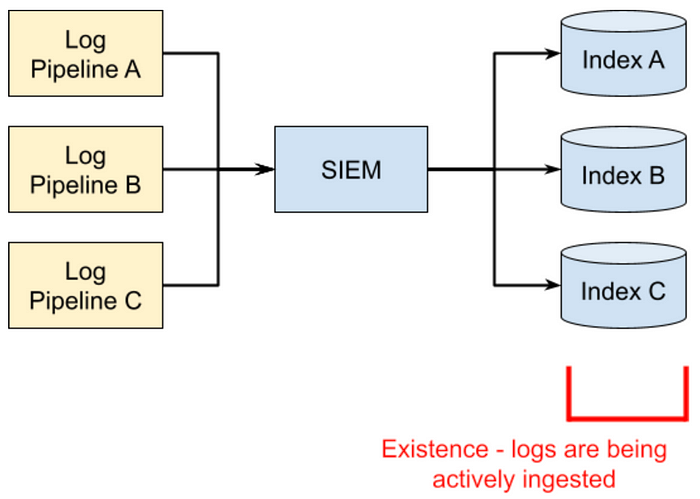
Existence is the simplest form of monitoring. The idea here is simply to ensure that logs are flowing. For each index, you just need <Index>, <Type>, <Time Frame>, and <Alert Mechanism>.
In English, this would read: “Check for new logs within the last <Time Frame> for the <Index>, <Type>, and if you don’t find anything, then send an <Alert>.”
This format lends itself well to automation from a CSV to a monitoring platform. The advantage of codifying these alerts or thresholds as a CSV is that it democratizes the configuration, better enabling cross-team collaboration. However, if you are going to implement all of the checks below, I’d recommend moving to a Terraform module.
Log monitoring: latency

There is always a delay between when an event was generated and when it was indexed within the SIEM (i.e., when the event is searchable).
Ideally, this time should be as short as possible (less than one minute) to enable rapid responses to an adversary’s actions. However, there are many reasons why this might not be the case.
For example:
- The log source batches logs into groups based on time.
- The log source is having some form of an outage.
- The host time on the log source is off.
- SIEM ingestion is overloaded and backed up.
- Old log files from the baked image or container are getting picked up.
The majority of searches in a SIEM are time-bound (i.e., a check of all the logs from the past 30 minutes), with the source time used as the default time. If the search parameters are less than the latency, events can go undetected.
An example: An application rolls up logs every 30 minutes and ships it to the SIEM. You write a search looking for all events within the last 15 minutes using the source time. When the new batch of logs comes in, half of them occurred 15 minutes ago and are filtered out by your search parameters. If a suspicious event happened in that window, it would go undetected.
The harder part of latency checking is determining what metric to use for alerting. You could pick any of the following (or use all three of them):
- The age of the newest event (how close to the present is this batch of logs?)
- The age of the oldest event (how far in the past does this batch of logs go?)
- The median, mean, or 99% age of the events (what is the average age of the logs?).
The most important of these to check is the age of the newest event (i.e., are you still receiving logs that were generated recently?). A failure of this check means that some part of the system is failing to keep up with the latest logs. If this check passes but the other two fail, it indicates a more nuanced failure condition and likely only a partial failure.
If desired, you can add these three checks into the CSV format of the Log Monitoring: Existence check. Again, this will look better in Terraform.
Log monitoring: integrity
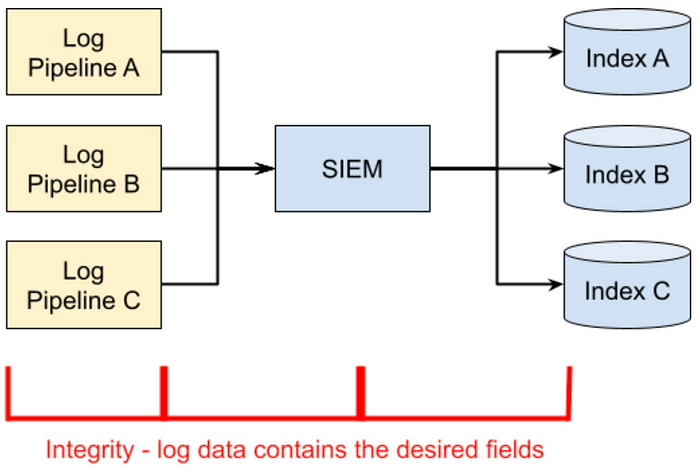
Over time, log formats are likely to change. This can cause searches to run in the SIEM to return either too much or too little data. Because of the nature of log data and SIEMs, these types of errors are often very difficult to detect without a strategy specifically for this purpose.
Even if the log creation phase stays the same, errors can happen during aggregation or transformation. Loglines can get too long and get truncated, messages can get incorrectly filtered, and enrichment steps can fail. All of these can erase essential fields, and the security team will be puzzled as to why their detection searches aren’t working.
The trick here is to put monitoring in place that checks log messages for the specific fields that the security team depends on and sends alerts if those fields are no longer showing up. This alert can be written at the creation, aggregation, or extraction phases, but what matters most is that the fields are usable in security alerts. Therefore, I propose implementing integrity checks as searches against the actual data.
Log monitoring: bandwidth
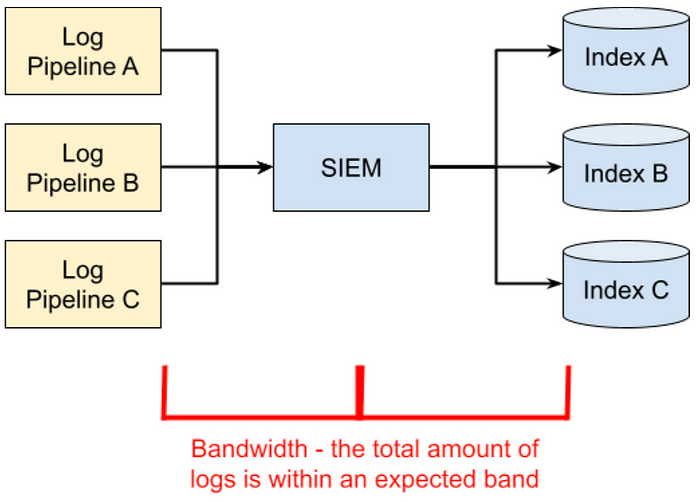
I didn’t originally consider bandwidth alerting to be a high priority. As long as we were receiving logs, within the right time frame and with the right data, everything was fine, right? Wrong.
One day, we had a typo in the product that caused debug logs to get sent to the SIEM. So many events were generated that we easily had ten times the amount of incoming data. This data scale was so massive that it made the data almost unsearchable across that one day. For legal reasons, we had to keep the data for three more years.
Bandwidth is a good metric to look at: what is the size and rate of incoming logs for each type, and at what threshold should you be alerted. While a simple metric threshold alert will work, I recommend looking into anomaly alerting as a more comprehensive alert.
There is also a question of whether an incident of this nature is of high or low priority. Can you deal with it during business hours? Or should it be a pageable event? This is where compliance, security, and finance all need a voice. If you can’t delete the data for three years and you are on a tight budget, then a page is warranted. However, if you can just purge the logs tomorrow, then a night’s worth of storage might be fine.
Log monitoring: coverage
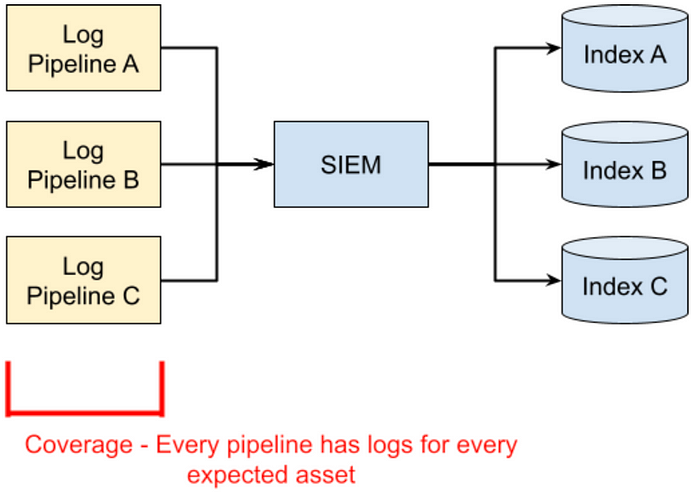
A coverage check is essentially an advanced version of an existence check. Instead of checking that any data is arriving in Index A, you are searching to confirm that all the data you expect to be in Index A is there. As an example, if you were running a tool like OSQuery on every host in your fleet, how do you know that every host is shipping OSQuery log data successfully? You need some way of identifying all the hosts that exist and comparing that against the data in the SIEM.
This is where asset management becomes important. I will go into much more detail regarding asset management later in this post, but the important part is that you have a list of all assets that (should) exist. Figuring out the source of truth for what exists is the most challenging part.
It’s worth noting that this approach does not guarantee that all the logs from each host are searchable in the SIEM — just that there exists at least some data per host. Getting more advanced would require telemetry metrics that are produced on the host itself that record how many events were generated. You could use these to confirm that every message is correctly arriving. This is very advanced and seems very prone to noise, so attempt this at your own risk.
Putting All The Alerts Together
If you wanted to cover all the alerts described above, you likely are going beyond what a CSV is optimum for. You’d also need to write your own CSV-to-alert automation, which is another intellectual chip you probably don’t have to spend. I recommend using an infrastructure-as-code tool like Terraform to create the required abstraction and automation. Below is an example of what a Terraform log monitor could look like:
This is just pseudocode, but I hope it gives you some inspiration on how to set up SIEM monitoring. Is there another angle that I’m missing? Do you have a simpler technique for monitoring? Please contact me! I’m always looking to learn more.
Critical Lessons Learned While Monitoring a SIEM
Define a standard log ingestion pattern
One major infrastructure mistake I’ve made was allowing various teams to choose-their-own-adventure regarding how their logs were ingested into the SIEM. Instead of being prescriptive with our solution, we wanted to present each team with a menu of options to pick from.
We provided each team with the option of an agent, an API, a third-party integration, or a pattern involving dropping files into an S3 bucket. This approach had many failings.
Vendor-provided API/Agent
The idea was that we would distribute an agent or credentials that would enable people to push logs directly to the SIEM. This was recommended by the vendor. How could it possibly go wrong?
- The first issue was that this model didn’t work for any of our more complex network requirements (not everything had direct API access to the SIEM). It also didn’t work for any SAAS.
- The second issue was that during every major infrastructure upgrade or improvement, we had to perform a coordinated upgrade to ensure that people’s pipelines didn’t break. In a company of thousands of engineers, this was an enormous task.
- The third issue was that we had no control over how people architected their redundancy and recovery if the SIEM itself had an outage. Some people wrote automation to retry log delivery would retry until successful. Other implementations just dropped the data, causing a partial log outage.
Vendor-provided integrations
The vendor provided integrations for many different services. Unfortunately, integration reliability was not part of the service contract. If Microsoft changed its APIs, the vendor didn’t provide any guarantees. The underlying integration code was poor, and we were constantly facing bugs or limitations.
Unfortunately, by the time we had figured out that the integrations were more trouble than they were worth, we were already dug in pretty deep. The only path to replacing them was to code our own pipeline which by that point was a significant undertaking. This also meant that we would then become responsible for updating our pipeline code every time the upstream services changed. Both options were poor.
Drop Data in Blob Store
This was, by far, the best solution.
Blob stores (Azure Blob Storage, AWS S3, Google Storage Bucket) are horizontally scalable and have exceptionally good redundancy. In addition, there are clients written in every language for these tools. It was easy to describe, easy to maintain, and hard to lose data.
Below is the architecture:
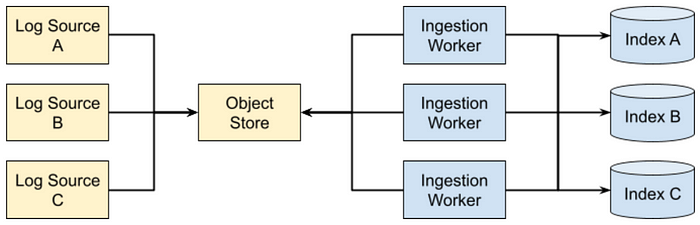
Log sources pipe data to a cloud object store using whatever language, framework, or application fits the use case. Object stores integrate with notification systems (i.e., publisher and subscriber patterns) to generate events when a new log file has been deposited. Ingestion workers (e.g., Filebeat) subscribe to the feed and pull down log files for extraction, enrichment, or last-minute filtering. The logs are then pushed to their appropriate indices in the SIEM.
In practice, this model works very well for the reasons below.
- Log delivery is pushed to the edges. It is the log owner’s responsibility to get the logs stored in an object store like AWS S3. The available tooling is vast, and the cloud-provided object stores are horizontally scalable to very reasonable levels.
- Log ingestion is simple and horizontally scalable. One can just keep adding workers to pull down log delivery events and perform last-minute filtering, extraction, or enrichment. This can easily be implemented as an auto-scaling set of workers in raw compute or as a container.
- The contract between producer and consumer is clear. If the logs are not being delivered to the object store, the producer is at fault. If the logs have arrived in the object store but not the SIEM, then the consumer is at fault. If there is a debate over the integrity of logs, one can look at the raw logs in the object store for diagnosis.
- Vendor agnostic. Because of the abstraction layer provided by the object store(s), it is possible to change the underlying SIEM without needing to rebuild all the pipelines. You can even run both in parallel during the comparison or migration phase.
As stated earlier, if we had started with this pattern from day one, we could have saved ourselves a world of pain.
The Importance of Asset Management in SIEMs
When we first deployed our SIEM, we didn’t strongly consider pairing asset management and log visibility together. We were very focused on extraction, transformation, storage, and searchability. While these were all essential, the lack of focus on asset management ended up creating an unsustainable model that took far longer to fix than it should have.
Examples of assets include lists of:
- every VM, Endpoint, Firewall, VPN device, and so on.
- third-party SAAS applications and upstream repositories that you integrate with.
- the list of public IP addresses in use.
- the list of domains in use.
Essentially, we weren’t thinking about building datasets into our SIEM. This became a problem when we had a partial outage of logs, due to a misconfiguration in AWS Commercial versus AWS Govcloud. Our immediate question was to ask how widespread the log outage was, but we had no easy lookup table of current or historic hosts. If we had been building this data from the beginning, it would have been much easier for us to root cause of the extent and duration of the outage.
Takeaway: Spend the time to design asset datasets that you incorporate into your SIEM. These are useful in both security and operational use cases.
Log Monitoring: A Joint Effort Between Security and DevOps
It is common to keep core infrastructure teams separate from the security team, as their outcomes, skill sets, and staffing levels are significantly different. However, this border gets muddy around security-sensitive logging pipelines. Who is responsible for monitoring a log pipeline or integrity outage?
If the entire problem is shifted over to the DevOps teams, you run into a significant challenge in determining exactly what to monitor and what its priority is. From experience, I can tell you that setting every log pipeline to a page is untenable in a large ecosystem (and conversely, setting everything to low priority is inappropriate). Especially in a sufficiently large company, there are often multiple business divisions between the team that manages the SIEM infrastructure and the teams that manage the applications producing the logs.
If the entire problem is shifted over to the security teams, the security team ends up feeling the majority of the pain of logging outages and rarely having the ability to fix the underlying problems. This results in a message-passing game between the teams.
My proposal: The security team and DevOps teams should work together to establish a contract on how to treat a logging pipeline.
This proposal should cover the following:
- setting alert thresholds together (What are all the values for existence, latency, and bandwidth?).
- identifying critical fields (Which fields does the security team need, on a per-pipeline basis?).
- criticality (Which pipelines are essential for rapid response ADSs and should page an engineer, and which ones can wait for normal 9–5 support?).
- documenting a support contract between the teams (When, inevitably, something fails, how do the two teams work together to collaboratively find the root cause and resolve the issue?).
A collaborative relationship like this will dramatically improve the overall usefulness of the SIEM ecosystem. Outages will be prioritized according to their security needs, infrastructure teams will be better able to identify partial outages or logging format issues, and security will have a clear line for communication and resolution
Wrap-Up
SIEM management (especially around pipelines) is very important to the lifeblood of a security team. As attackers are getting more sophisticated and the infrastructure more abstract, so are the visibility needs of the security team. Every major company, therefore, has to solve high-quality SIEM monitoring if they want to protect their customer’s data or assets.
My proposal is to tackle monitoring using a five-pronged approach: existence, latency, integrity, bandwidth, and total coverage. I believe that the pipeline thresholds and alert severity should be set in collaboration with the security team. The pipelines themselves should follow a simple, scalable, standard that pushes the application-specific portion to the application owners. And finally, it needs to be part of your strategy to build asset datasets into the SIEM in order to simplify and improve total coverage monitoring.

