Kubernetes Observability Part 1: Events, Logs, and Integration With Slack, OpenAI, and Grafana
Build a Kubernetes custom controller to watch Kubernetes Events and forward them to Grafana Loki using Promtail

TL;DR: Build a Kubernetes custom controller with Kubebuilder to watch Kubernetes Events, push them to Grafana Loki with Promtail, and visualize their data and metrics on a Grafana Dashboard.
Introduction
In this article series, we will explore a one-stop-shop Observability solution for Kubernetes, where a custom Controller does the following:
- watches the Kubernetes Events in a cluster
- forwards them to Grafana Loki via Promtail
- decorates the one that indicates a problem with the Pods’ Logs that were recorded in the timeframe that each Event took place
- sends an interactive message to a Slack channel/bot that on-demand could ask OpenAI Chat API to help us solve the error based on the original Event message
The series will consist of three parts:
- Part 1: Create a custom Controller, forward Events to Grafana Loki, present Events, and Logs on a Grafana dashboard
- Part 2: Build the integration with Slack and forward alerts.
- Part 3: Build the integration with OpenAI Chat API and get a solution proposal.
This is the first part of the series.
What are Kubernetes Events?
In Kubernetes, Events are messages that describe the state of objects within the cluster. They provide information about changes in the cluster, such as when a pod is created, updated, or deleted. Events can be used for monitoring, debugging, and auditing purposes.
Events have a specific structure that includes information such as the object that the event is related to, the event type (e.g., Normal or Warning), the reason for the event (e.g., FailedScheduling, SuccessfulCreate, NodeNotReady) a timestamp and a message that provides additional details.
They are stored in the Kubernetes API server and can be accessed through the kubectl command-line tool or through the Kubernetes API:
kubectl get events --field-selector type=WarningBy default, events are only stored for a limited period of time (one hour by default), but this can be configured using the
--event-ttlflag when starting the API server.
What Is a Kubernetes Custom Controller?
A Kubernetes custom controller is a custom-built Kubernetes controller that extends the functionality of the Kubernetes API server. It allows users to define their own custom resources, associated controllers, and operators to manage the state reconciliation of those resources or even observe the state of Kubernetes core resources like namespaces, pods, events, etc. These controllers can automate tasks, handle complex workflows, and enforce custom business logic.
Custom controllers are typically created using one of the Kubernetes client libraries, such as the official Go client library, or a higher-level framework, such as the Operator SDK or Kubebuilder.
In this article, we are going to use the latter. These tools provide abstractions for interacting with the Kubernetes API, allowing us to focus on writing controller logic.
A custom controller typically operates by watching the Kubernetes API for changes to a specific resource type (custom or not). When a change is detected, the controller takes action to ensure that the desired state of the resource is ensured. For example, a custom controller might create a set of pods when a custom resource of a certain type is created and then scale the number of replicas up or down based on the current demand.
Custom controllers can be used to manage any resource that can be represented as a Kubernetes resource. This includes applications, databases, message queues, and more. Custom controllers are a powerful way to extend Kubernetes and customize its behavior to meet specific needs.
This article will not be a primer on creating Kubernetes custom Controllers or Operators with Kubebuilder. If you are new to the topic, consult the official Kubebuilder book before proceeding, or have a look at this very good article by Stefanie Lai:
Create a Custom Controller That Watches for Events
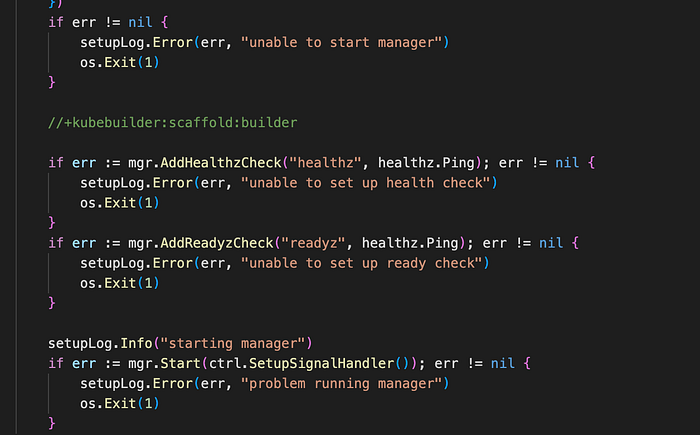
After we sorted all that out, let’s start building our custom controller. As we said above, we are going to use Kubebuilder. The first step is to bootstrap our project with kubebuilder initand generate configuration scaffolds along with the source code of the manager — main.go, the endpoints for Prometheus metrics and liveness probes (we are going to call the project eventviewer).
Remember: A single manager can handle the lifecycle of multiple controllers.
mkdir -p ~/go/src/github.com/akyriako/eventviewer
cd ~/go/src/github.com/akyriako/eventviewer
kubebuilder init --domain eventviewer --repo akyriako/eventviewer
Adjust the path, domain and repo according to your own preferences.
Now, we have the basis of our project. Next in the list is adding new Kubernetes API functionality, which will allow us to observe Events taking place in the cluster. That means we are not going to create a CRD (Custom Resource Definition) for a new Kind but just a controller that is going to watch cluster Events.
kubebuilder create api --group events --version v1 --kind EventThe command above will launch a CLI wizard, and the first question will be: “Create Resource [y/n].” That would be a “no” because we will watch a built-in Resource of Kubernetes — Events. The next question will be “Create Controller [y/n],” and here we will enter “yes.”
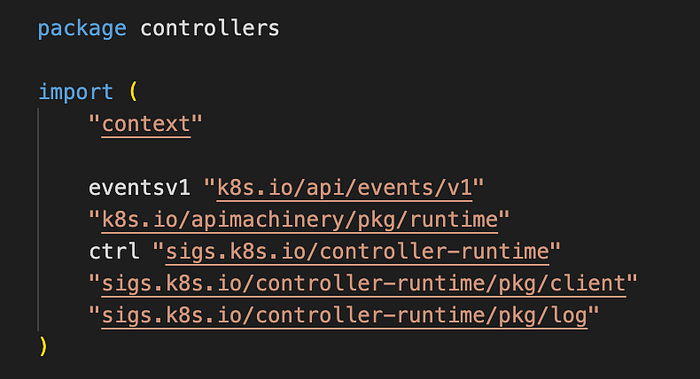
This time, do not adjust group & version flags because we want the wizard to be able to identify the correct dependencies for builtin Kubernetes Events that live in the package k8s.io/api/events/v1. It will be imported automatically when go mod tidy is ran by the wizard and added to your controller’s imported packages /controllers/event_controller.go:
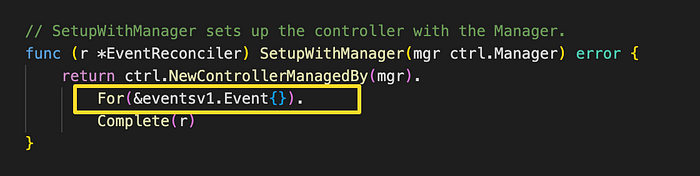
Additionally, the controller will be created (through the manager) with the capacity to watch Event resources in the cluster:
Now, we are ready to fill in the Renconcile method of our controller and instruct how to process changes on Kubernetes Event Resources:
func (r *EventReconciler) Reconcile(ctx context.Context, req ctrl.Request) (ctrl.Result, error) {
 logger := log.FromContext(ctx).WithName("controller")

 var event eventsv1.Event
 if err := r.Get(ctx, req.NamespacedName, &event); err != nil {
  if apierrors.IsNotFound(err) {
   return ctrl.Result{}, nil
  }

  logger.V(5).Error(err, "unable to fetch event")
  return ctrl.Result{}, err
 }

logger.Info("processed event", "note", event.Note)

return ctrl.Result{}, nil
This will fetch the Event that triggered the reconciler and log the Event message whenever a new Event (in the same namespace) is being recorded. Let’s run the controller using the following command:
make run
Forward Events to Grafana Loki Using Promtail
So far, so good. We haven’t managed a lot, but we have laid the foundation: We can now observe Events right when they happen! Let’s do something useful with them now. What we want to achieve is forward these Events to Grafana Loki and decorate the payload with Labels. Grafana Loki Labels are key-value pairs, and we can use them to describe any kind of metadata of our payload. If you are acquainted with Prometheus, it is exactly the same rationale.
If you haven’t got a Kubernetes cluster with Grafana, Grafana Loki, and Promtail already in place, follow this guide to set up one fast, as we are going to need it:
Grafana Loki supports many types of clients, official and unofficial ones. Promtail is the client that fits best when operating on a Kubernetes context (or on bare metal, but this is not our concern here) and can scrape various data and metadata sources. In our case, that goal is to forward data and metadata from a custom source (our controller). We are going to rely on an unofficial Promtail Go client:
Add the following package in the imports section of main.go and controller.go:
"github.com/ic2hrmk/promtail"We want (for efficiency and reasonable network resource consumption reasons) a single Promtail client to be initialised centrally in our manager and then passed to every controller’s instance. Let’s go and amend our manager — line 89, after creating a new manager and before creating a new reconciler:
We can have some common global labels that will decorate all streams that will land from this controller to Grafana Loki. It would make sense to create two labels, one for the cluster name and one for the scraping job. Additionally, we are going to need the endpoint of the Grafana Loki Push Gateway as a variable(not as a label):
labels := map[string]string{
  "cluster_name": "k3d-eventviewer-debug",
  "job":          "eventviewer",
 }

lokiPushGatewayUrl := "http://localhost:18080"
Of course, we can add these label values in the YAML configuration of our manager, and avoid injecting them as magic-strings directly in the code (bad practice). We will see later in this series how we can do that. At the moment, let’s focus on getting things rolling.
In my case, I port-forward the Loki Distributed Gateway
Serviceto local port 18080, and my gateway Url would behttp://localhost:18080. Adjust accordingly as you see fit. I am port-forwarding the gateway Url because we are still running our controller externally and we cannot yet utilize internal Kubernetes services endpoints.
Then, let’s create an instance of a Promtail client:
promtailLog := ctrl.Log.WithName("promtail")

promtailOptions := promtail.WithErrorCallback(func(err error) {
  promtailLog.Error(err, "promtail client internal error")
})

promtailJsonClient, err := promtail.NewJSONv1Client(lokiPushGatewayUrl, labels, promtailOptions)
if err != nil {
  setupLog.Error(err, "unable to start promtail client")
  os.Exit(1)
}
defer promtailJsonClient.Close()

setupLog.Info("starting promtail client", "lokiPushGatewayUrl", lokiPushGa tewayUrl)
Instead of reading logs for errors that happened in the Promtail client, we can integrate those logs in the controller’s runtime logs by initialising a Promtail client with the option WithErrorCallback(errorHandler func(err error)) as a part of the promtailOptions parameters (additionally to common labels and Loki Gateway Url) passed to the new client.
We need to pass promtailJsonClient to EventReconciler. For that matter, let’s put a pin here and go back to event_controller.go to extend that struct. Add two fields, one of type promtail.Client that will receive the Promtail client we just instantiated in the manager and one of type map[string]string that will hold the common labels for our streams.
type EventReconciler struct {
 client.Client
 Scheme *runtime.Scheme
 PromtailClient promtail.Client
 CommonLabels   map[string]string
}
Let’s return to main.go and pass those values to the instance of our new controller:
if err = (&controllers.EventReconciler{
  Client: mgr.GetClient(),
  Scheme: mgr.GetScheme(),
  PromtailClient: promtailJsonClient,
  CommonLabels:   labels,
 }).SetupWithManager(mgr); err != nil {
  setupLog.Error(err, "unable to create controller", "controller", "Event")
  os.Exit(1)
 }
Now our controller is employed with a brand new Promtail client initialised and ready to be used to forward messages to Grafana Loki. In the Reconcile method of our controller, we haven’t done much so far after retrieving the Event — we just print the Event.Note to the logs. Let’s expand it a bit as follows:
We want to extract specific Event attributes promote them as metadata, decorate our payload with them, identify whether the Event.Type if Normal or Warning and eventually, send the payload using Promtail client to Grafana Loki.
func (r *EventReconciler) Reconcile(ctx context.Context, req ctrl.Request) (ctrl.Result, error) {
 logger := log.FromContext(ctx).WithName("controller")

 var event eventsv1.Event
 if err := r.Get(ctx, req.NamespacedName, &event); err != nil {
  if apierrors.IsNotFound(err) {
   return ctrl.Result{}, nil
  }

  logger.V(5).Error(err, "unable to fetch event")
  return ctrl.Result{}, err
 }

extraLabels := map[string]string{
  "namespace": event.Regarding.Namespace,
  "pod":       event.Regarding.Name,
  "kind":      event.Regarding.Kind,
  "type":      event.Type,
  "reason":    event.Reason,
 }

level := promtail.Info
if event.Type != "Normal" {
  level = promtail.Warn
}

r.PromtailClient.LogfWithLabels(level, extraLabels, event.Note)

logger.V(5).Info("processed event", "note", event.Note)
return ctrl.Result{}, nil
Add the following package in the imports section:
apierrors "k8s.io/apimachinery/pkg/api/errors"Run the controller once again:
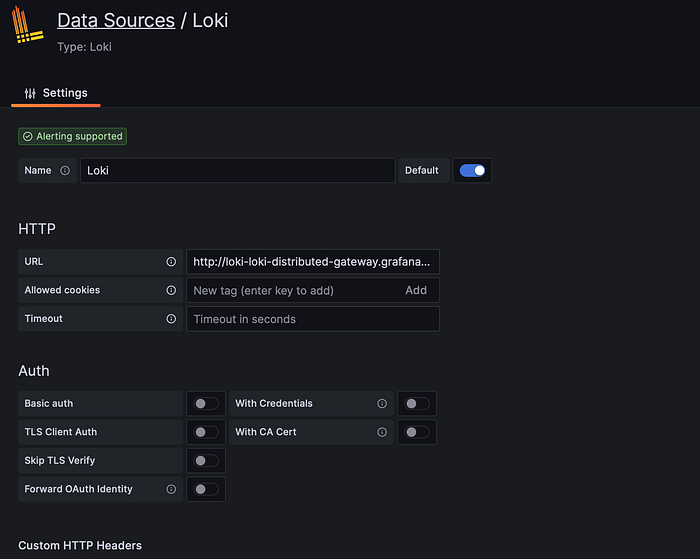
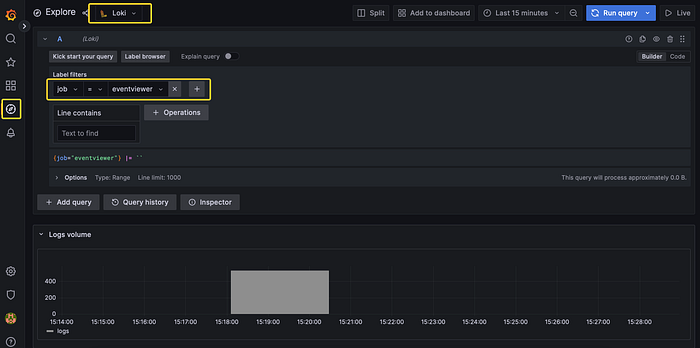
make runOpen your Grafana instance from the browser and add Loki as a new data source, if you haven’t already done so, using the URL http://loki-loki-distributed-gateway.grafana-loki.svc.cluster.local—as long as you followed the separate guides provided above. Otherwise, use the endpoint of the gateway endpoint that matches your environment:
Go to “Explorer,” choose (“Loki”) as the data source, and in “Label filters,” choose job with value eventviewer.
Remember: We set a couple of common labels (
cluster_name,job) for our streams while creating the Promtail client in our manager.
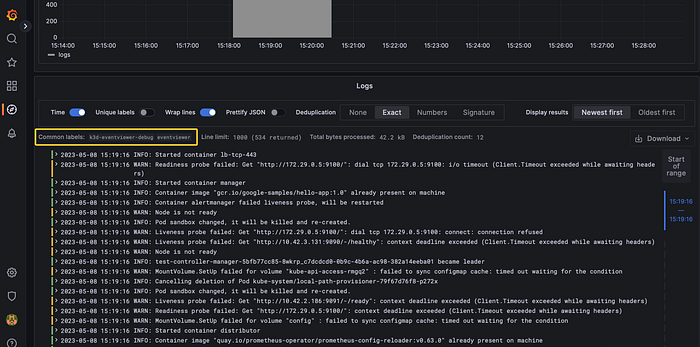
That is a sign that we have successfully accomplished two things:
- Creating a custom controller that watches for Events
- Forwarding those Events to Grafana Loki via Promtail
Random hint: If you don’t want to see the whole stack trace messing with your controller’s logs in case of an error, go to main.go and set StacktraceLevel to zapcore.DPanicLevel in your zap instantiation options:
opts := zap.Options{
  Development:     true,
  StacktraceLevel: zapcore.DPanicLevel,
 }
Let’s proceed to our next step.
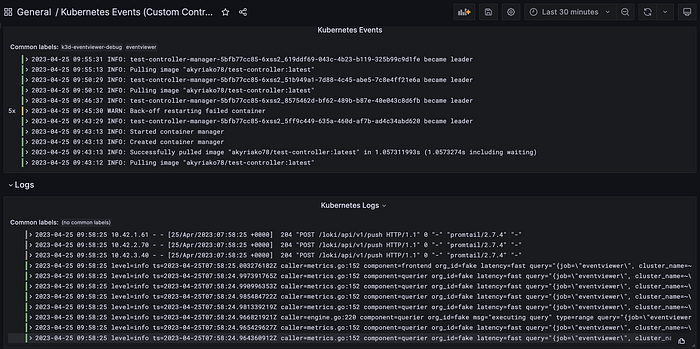
Bring Them All Together in a Grafana Dashboard
Until now, everything seems to work fine, but still, the added value is low. It would be extremely helpful if we could do the following:
- Consolidate the stream of Events and get simple statistics on their occurrences
- Place their corresponding pod logs on a simple Grafana dashboard and filter them by the labels/metadata we decorated our payload in our controller (e.g., cluster name, namespace, pod, container, kind, event type, event reason).
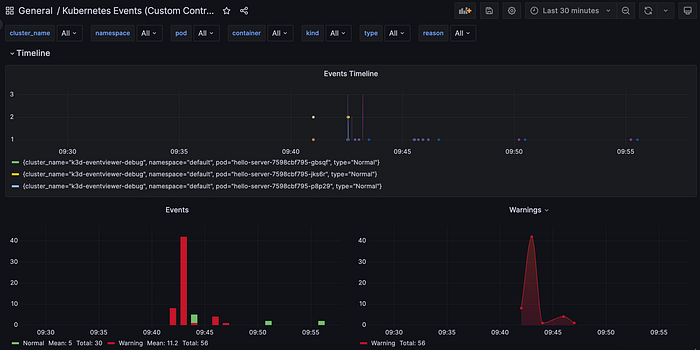
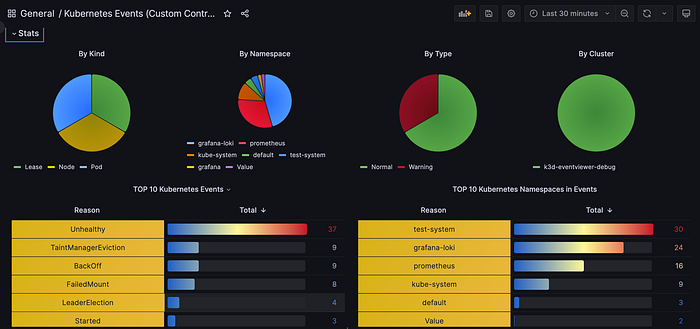
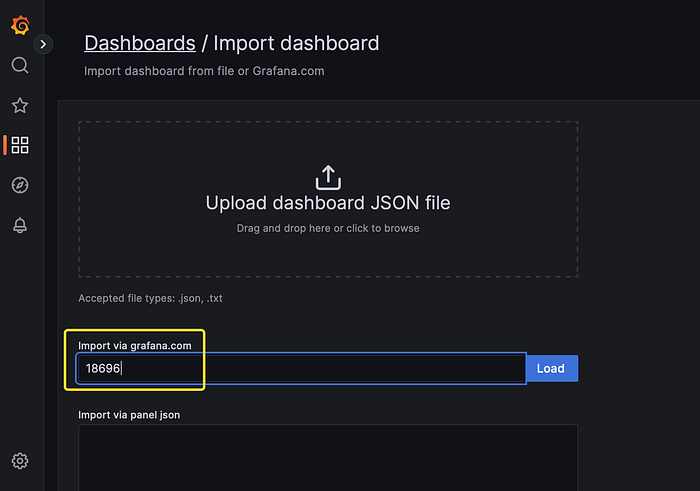
Go to Dashboards and import the dashboard with ID 18696, which will automatically download and configure the dashboard from grafana.com
Next Steps
In the second part of this series, we will see how we can take this custom controller a click further by integrating it with Slack and sending all Events of type Warning to a Slack channel as custom interactive alerts.
You can find the source code here:

