Tips for Using IntelliJ Efficiently — Debugging Like a Pro
Tips and tricks I learned and use daily
You’d be surprised by the amount of people that still use print statements in the code to debug and those might do the job but won’t get you far enough when you need to debug something more complex or if you aim to be more efficient.
Often, that has nothing to do with the level of experience or knowledge but with putting in the effort and time to explore the features of the IDE of choice. So, I am gonna share some cool tricks you might have missed so far and could end up saving you a lot of time and time is money (either yours or your company's).
Line breakpoint.. with a spin
I am not gonna blow your mind by telling you that you can add a line breakpoint by clicking on the left bar on that line. Everyone that’s ever debugged something in any IDE knows this

I am gonna focus on something more interesting
Break on condition
A right click on an already placed breakpoint would open a pop-up window with a few options.

One of the things I use most commonly is the Condition section, where you can put an expression evaluating to boolean using the variables in the scope of the line and the debugger would only break if the condition is true.
Suspending single thread only
By default, in the pop up you’ll see the All radio button selected. However, if you choose the Thread one, you can suspend only the thread executing the line of code where the breakpoint is.
This is usually useful when you have threads, which, if suspended, might throw exceptions and die, like threads consuming from Kafka or querying a database with a timeout. Having only one thread stop might help you keep the app running and healthy while you examine the bit of code that might be problematic.
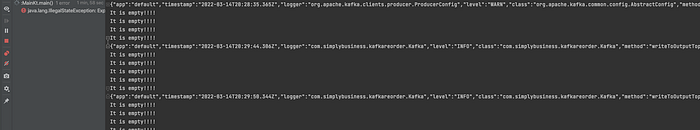
Print debug statements… on steroids
Remember how I said print statements are not great. Well, I meant those ones you put in the code. They are not ideal because you need to restart the app every time you need to edit or add prints and, what’s worse, you might accidentally commit those and either expose sensitive information or just cause a lot of spam in the logs.
So, the alternative is…..drum roll.. print using the options IntelliJ provides.

In the default pop up, by default the Suspend checkbox is selected. If you deselect it, the window will expand revealing a whole lot more options. One of those is Evaluate and log which means that every time the debugger would normally suspend (no matter if it’s a normal breakpoint, with a condition, suspending one or all threads) it will print whatever the statement in that textbox evaluates to instead. It can either be a string literal or anything using the variables in the scope.
Exception breakpoint
Sometimes, though, you cannot pinpoint the exact line causing the problem. For example in multithreaded applications exceptions are being swallowed and appear as side effects somewhere else or you are not sure where the exception is thrown from due to lack of proper logging or you just need to approach the problem more generally. In those cases, you can add a breakpoint exception.
If you hit Ctrl + Shift + F8 | Cmd + Shift +F8 you’ll see this window listing all currently added breakpoints.
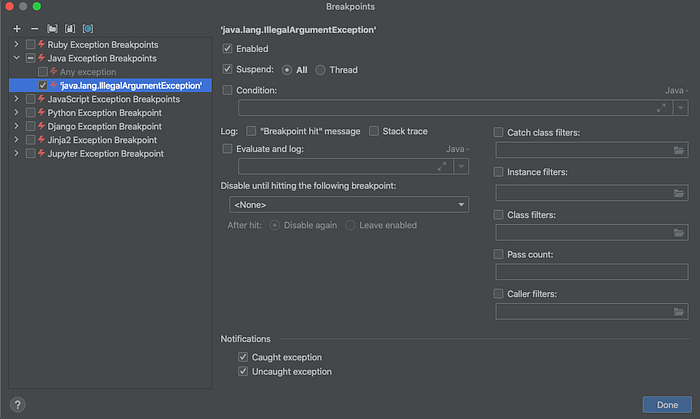
Additionally, you can either add a breakpoint for Any Exception for the current project’s language or a specific exception class.
Keep in mind that sometimes frameworks like Spring might have internal exceptions on startup so it’s a bit annoying to start up your app with that kind of exception and get suspended in places you are not interested in.
Also, as you can see in the right panel, those breakpoints also follow the same rules and provide the same options as the line ones.
Debugger Pane
Once the execution is suspended there are few things in the Debugger pane I want to point out.
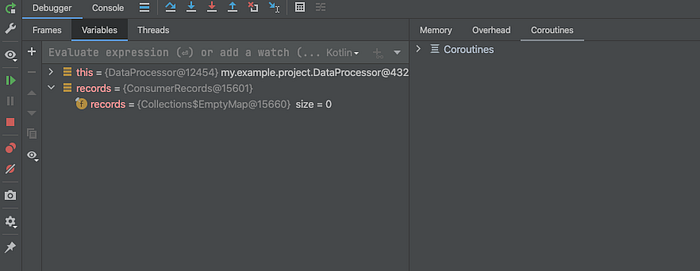
Variables
This is the tab most familiar to people — besides hovering over variables in scope, you can review their values at the time in the variables pane.
Frames
Slightly less familiar tab is the frames one.
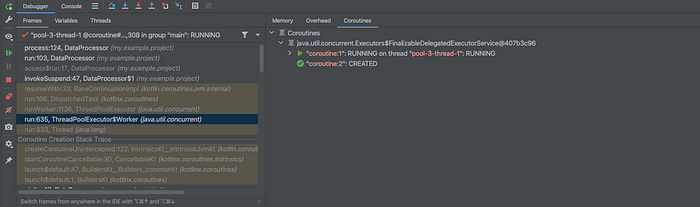
The interesting bit here is not only that you see the stacktrace (what was the app’s path to this line of code) but also that you can actually travel back in time. You can click on the individual frames and review the values of the variables in that scope at the time the code went through it. Which is incredibly useful when tracking down unexpected values.
Threads
The last tab here is the Threads one. It provides a way to check where all the other threads are (if they are also suspended) at that moment.

Profiling
Sometimes, unfortunately, a breakpoint is not enough and you need to use some more serious tools. Mostly those are tools used to detect memory leaks and high CPU usage. The Profiler in IntelliJ provides a lot of the functionalities that previously we needed external tools for.
You can open the Profiler pane through the View Menu|Tool Windows|Profiler or it might already be visible somewhere in the left|bottom|right corners. If there is a Java process running it will appear there.

The interesting bits are hidden in the context menu.
CPU and Memory Live Charts
This will show you a timeline graph of the memory and CPU usage of the app while it’s running.
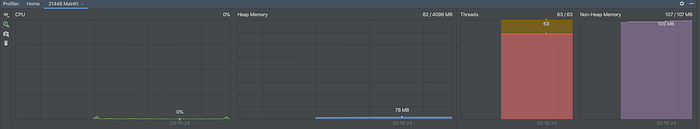
It can be very useful if you want to gauge where the app is at in terms of resource usage or detect any abnormal spikes or drops in either of those.
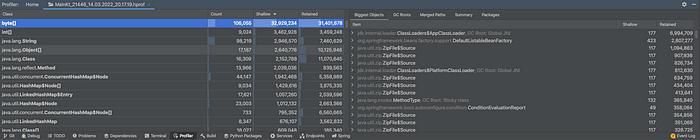
Capture Memory Snapshot
A memory snap is a step further or a complimentary step to the live charts. You can see the actual objects and primitives filling up that memory and this might help you identify where a leak is coming from.
The other 2 options I’ve used way less to be honest but will mention quickly
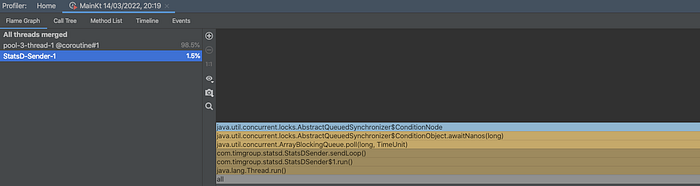
Attaching profiler
Attaching a profiler or running the app with a profiler will give you a lot of information like a list of all methods executed while the profiler was running, all events that occured (such as GC, memory alloc etc) and more.
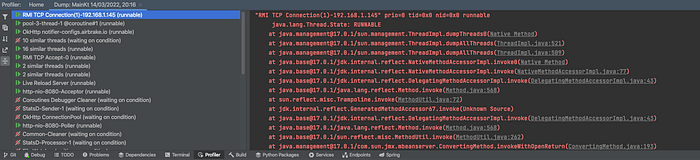
Get Thread Dump
This will print the stacktrace for all threads in the app at that time.
Hope you found some new bits here that you’ll go on to use daily. IntelliJ does quite a lot for you so don’t be afraid to click around.
If you want to learn more about how to save time and avoid errors have a look at my previous article — 10 IntelliJ Shortcuts For Efficient Refactoring.