Improving Code Design With OpenTelemetry — A Practical Guide
What every developer needs to know about observability and how to leverage OSS tools to make your code better

This is the second in a three-part series that will review some of the observability technologies available to developers today, why they make coding better, and what specific insights they can provide. Here is the link to part one in case you missed it.
TLDR: In this post, we’ll run through some real-world examples using some OSS:
How We Got Here
In the previous post, we discussed the role of observability in the modern developer stack. How measuring and studying runtime behavior can help validate our code assumptions — in a similar way to tests.
This time, we’ll leave the theory aside and focus on how to make that happen. I’ll be using a sample application for reference, but nothing that will be discussed here is application- or language-specific. I’m also keen to learn about your own interpretations and applications to other systems and toolings.
Not Another CRUD App
In order to demonstrate more realistic scenarios, I sought an application that goes beyond a simple CRUD implementation and basic scaffolding. That quest proved much more difficult than I expected. It appears that it is not that trivial to find good samples with real domain logic depth or even applications that combine a more complete stack of tools and platforms.
Eventually — and perhaps inevitably — I was drawn to making my own sample based on a template I found online. You can find the original template repository here. I chose a basic setup that relies on open source platforms and libraries:

I once made a ‘money transfer’ example service I was fond of, mostly because of the ability to add some logic, validation, and additional external processes that made it interesting. For this post, I decided to add some more characters to my original sample. To make the exercise less bland, we’ll be working on an API for the Gringotts Wizarding Bank!
The theme provides plenty of opportunities to add complexity and obstacles that will put some more meat on our code. Two quick disclaimers: One, I am not an expert on HP lore, so bear with me for improvising. And two, this application is not supposed to be a model of how to structure a well-architected app. Quite the contrary, we want to see how bad design decisions will reflect in our observations.
Prerequisites
- Clone or fork the sample Github repo:
git clone https://github.com/doppleware/gringotts-vault-api.git- Have Python 3.8+ installed
- Make sure you have Docker and Docker Compose installed. We’ll use both of them to fast track through the setup and configuration.
- Use VS Code if possible, as some of the later examples will rely on that.
Turning code observability ON in two quick steps
- We’ll want to launch the observability tools we’ll use in our example. Using a bit of docker-compose, this step is trivial. We’ll be spinning up several containers:
- A Jaeger instance. We’ll use Jaeger to visualize our distributed traces. We’ll be launching an all-in-one version of Jaeger that is suited to run as a local instance.
- An OpenTelemetry collector. You can think about this component more simply as an observability router. Using a collector is optional but provides the benefit of being able to modify our observability source, targets, and rates without making any code changes. It has a separate configuration file, which defines the way the collector will receive traces (from our application) and export them to the jaeger instance.
- Digma for continuous feedback — We’ll discuss Digma at greater length towards the end of this post.
To launch everything, simply run the following commands from the repo root folder:
docker compose -f ./observability/tracing/docker-compose.trace.yml up -d
docker compose -f ./observability/digma-cf/docker-compose.digma.yml up -d
Once everything is up and running, visit http://localhost:16686/ to check the Jaeger instance is up. Here’s what you’ll see:
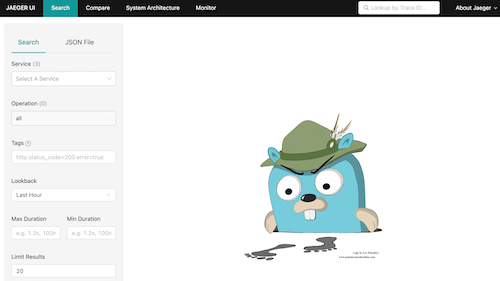
That’s it. No data yet, but the tracing backend is ready!
2. Now that our trace backend is up and running, it is time to instrument our application to send data to it. This is where we reap the benefits of OpenTelemetry’s widespread adoption. It is simply a matter of specifying the right packages and activating the instrumentation in the code. The example here is a Python stack, but you’ll find similar packages for most other languages from GoLang to .NET, Java, or Javascript.
In our case, I’ve added the following packages to the project requirements file. It’s a handful:
opentelemetry-instrumentation-fastapiopentelemetry-instrumentation-loggingopentelemetry-instrumentation-asyncpgopentelemetry-instrumentation-pikaopentelemetry-instrumentation-httpx

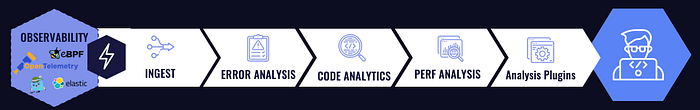
The diagram above shows the breadth of coverage for the automatic instrumentation available with common platforms and libraries. Each purple rhombus represents a tiny probe that is already instrumented for OpenTelemetry and is ready to start transmitting. With so much data at hand, it becomes less of a matter of obtaining information on runtime usage and more of how to put it to use to get to the right conclusions.
Configuring OTEL
Turning all of that instrumentation on is simple. First, we add some basic OpenTelemetry setup that consists of specifying some basic information on what we are tracing and how we want to export the data. We‘ll be using the standard vanilla implementation of the different components that comes with the OTEL package. The code below configures OTEL to send out all of the observability data to our ‘router,’ the collector container we started previously listening to at localhost:4317.
Additionally, you can see some calls to different instrument() functions, which basically turn on each of the automatic instrumentation packages we included in our project. All in all, pretty standard boilerplate code.
As I mentioned in the previous post, it is not in the scope of this post to go deeper into the setup and configuration of OpenTelemetry. The OTEL website has great documentation on the topic.
So… What Now?
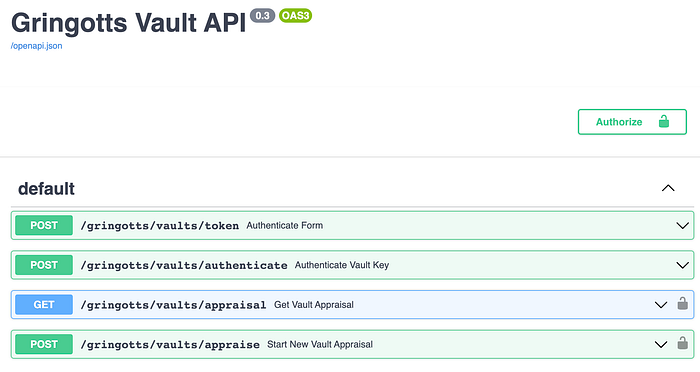
Now we get started! Our sample app is a simple API service with some added logic to make things interesting. The API provides a modern way for wizards to access their vault, check their ‘balance’, and even order an appraisal of its content.
Let's install the application requirements (it's recommended to use a virtual Python environment. In this example, we’ll use venv):
python -m venv ./venv
source ./venv/bin/activate
pip install -r ./gringotts/requirements.txt
Open the application in the IDE, and don’t forget to change the interpreter to use the venv environment we created.
Start the application for the IDE or command line, or just use docker-compose again to get it running using this code:
docker compose --profile standalone -f docker-compose.yml -f docker-compose.override.standalone.yml up -dRun the following to seed the application with some data we can play with. We can run ./seed/seed_data.py directly or just launch it from a container, as shown below:
docker compose -f ./docker-compose.seed.yml up --attach gt-seed-dataThe script will import and generate some data, which is also based on a Harry Potter dataset I found online.
We now have a working API to play with at HTTP://localhost:8238/docs.

Wait… Where Is the Observability?
It's already there. Much of it is provided by the automatic instrumentation we reviewed before, and we’ve already added some tracing in the code. OpenTelemetry allows us to define Spans. Spans represent a logical breakdown of the overall process of handling a request into meaningful, granular pieces.
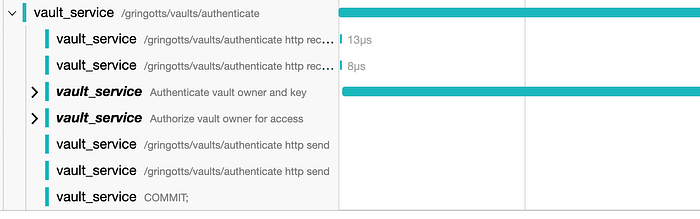
For example, when authenticating a customer at Gringotts, the process might include checking their vault key first, authenticating their identity, and then validating that the vault number the customer requested to access indeed belongs to them according to the records. Each of these steps can be represented as a separate span, and it is meaningful to understand and track its behavior and performance.
This is what the Span declaration looks like in our code; the start_as_current_span function declares a logical unit called ‘Authenticate vault owner and its key, which we’ll now be able to track. In a very similar way to writing log messages, we can gradually add more and more tracing into the code and thereby improve our ability to track its inner workings.
Let's generate some data to see what that looks like. We can trigger a few API operations like logging in via the swagger ‘authenticate’ button (username: hpotter, password: griffindoor).
Alternatively, we can run some tests that will already generate plenty of data to look at. We can run our tests using the Pytest command line or just launch the test suite via docker-compose. Notice that we’re also seeding data before running the tests to create more realistic conditions and hopefully better data. Here’s the code:
PYTEST_ARGUMENTS="--seed-data true" docker compose --profile test -f docker-compose.yml -f docker-compose.override.test.yml up --attach gt-vault-api --abort-on-container-exitNow, let's check out what our observability looks like. Open your Jaeger instance at http://localhost:16686. In the Jaeger UI, we can select the ‘vault_service’ service and the “/gringotts/vaults/token” or “/gringotts/vaults/authentication” operations.
If we expand the span row that seems to be taking the most time, we’ll find an obvious problem there, which you can see below:
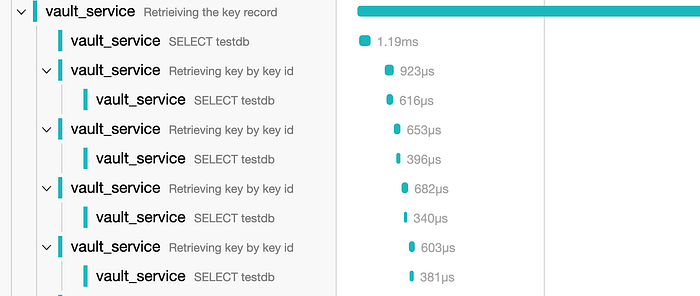
Looks like repeated SQL calls due to suboptimal implementation. If we look at the code, it is immediately apparent someone implemented this specific section of the code in the worst way possible. Perhaps job security?
If we filter the Jaeger interface to look at the ‘Appraise’ operation, we’ll be able to see how distributed tracing actually connects the dots between the different application components. We can examine the complete picture of the request lifecycle. Looking at complex systems with multiple microservices at work with asynchronous as well as synchronous flows. Below, we can see the handover between the FastAPI and the ‘GoblinWorker’ service via the RabbitMQ queue.

With this data in hand, it is possible to start measuring and checking code changes and validating what we think fixed the issue. Not only that, as we’ll discuss in the next post in the series, we can compare these traces to actual CI/staging/production data to identify trends and measure whether our fix actually worked under real-life conditions and data.
But How Often Would I Actually Use It?
This is the main problem with accessing tracing as a developer. There is a wealth of information, but it is hard to know when to explore it and how to get to the right conclusions. The more interesting insights actually come to light not by analyzing a single trace but when aggregating and comparing multiple similar traces that somehow behave differently. This helps us understand why some users are seeing more errors or are experiencing poor performance.
This is where continuous feedback fits in. Namely, the ability to continually analyze these traces using bottom-line type conclusions, just as we would consult our CI build. If we could automatically be alerted of multiple queries being called inefficiently, growing slower with time, or that the scale factor of the entire request is deteriorating (performance per call), that would allow us to optimize our code better.
Enter Digma
The last tool I wanted to discuss and demonstrate today is also the one I care about the most. Full disclosure: I am the creator of Digma. I’ve written about the need for it as early as September of last year. I feel comfortable showcasing it here because it is both open source/free and not yet released officially. Also, it really encapsulates my own thoughts about what continuous feedback could become.
I’ll also add a disclaimer to the disclosure: this is an early pre-beta release, so don’t run it in production just yet!
To see continuous feedback in action, we can install the VS Code plugin from the marketplace. If you recall, we already deployed its backend previously as a part of the tracing stack.
If the OpenTelemetry packages and libraries we enabled automatically instrumented our code, Digma automatically ingests that data to produce insights. After opening the workspace, we can now toggle observability data for any function or area of the code. For example, here is what it suggests about the ‘authenticate’ function we discussed before:

We can ignore some of the more production-oriented insights for now (level of traffic, for example), but even these simple pieces of information make it easier to produce, review, and release the code. Instead of comparing traces or skulking around different dashboards, we have the code insights available here because they are relevant to the code we are working with.
Where to Next?
We'll see what happens in the final post in the series when we throw additional data into the mix — production, staging, and CI. We can derive even more relevant and objective insights to check our code with these observability sources. We’ll be able to identify phenomena unique to production and measure and improve feature maturity levels.
You can reach me on Twitter at @doppleware or here.
Follow my open-source project for continuous feedback at https://github.com/digma-ai/digma
