How to Use Pandas to Consume Data and Perform Data Analysis
An introduction to data analysis with Pandas

Pandas is a Python package providing fast, flexible, and expressive data structures designed to make working with “relational” or “labeled” data both easy and intuitive. It aims to be the fundamental high-level building block for doing practical, real-world data analysis in Python. Additionally, it has the broader goal of becoming the most powerful and flexible open source data analysis/manipulation tool available in any language. It is already well on its way toward this goal — source (https://pandas.pydata.org/)
Installation
To get started with pandas, let’s install it. Installing pandas as part of Anaconda is recommended, but we can still install it using pip.
pip install pandasThe pandas module is usually imported as an alias pd, and all operations are done using pd, as shown below.
import pandas as pdPandas support 2 types of data structures namely:
- Series
- DataFrame
A DataFrame is a 2-dimensional data structure (an array within an array) that can store different types of data in rows and columns. You can think of it as similar to a spreadsheet or SQL table.

DataFrame
Let’s start by creating a simple dataframe with the following data.
Here we create a Python dictionary whose keys are used as column headers and the values as columns
The result will be:
      First_name Last_name                  Email
0       Matt  Mckinney     mattneey@gmail.com
1      Harry   ndarray  Harryndarry@gmail.com
2        ete       Wes      petewes@gmail.com
Our table has 3 columns namely First_name, Last_name, and Email.
To get the first 2 rows
df.head(2)The result is:
      First_name Last_name                  Email
0       Matt  Mckinney     mattneey@gmail.com
1      Harry   ndarray  Harryndarry@gmail.com
Another way to create a dataframe is using a list as shown below
Read and Write Tabular Data
Let’s read data from the following CSV file. A CSV(Comma Separated Values) contains data separated by commas.
pandas provide the read_csv() function for reading csv files into pandas DataFrame. Other file formats supported b pandas include:
- csv,
- excel,
- SQL,
- JSON,
- parquet
import pandas as pd
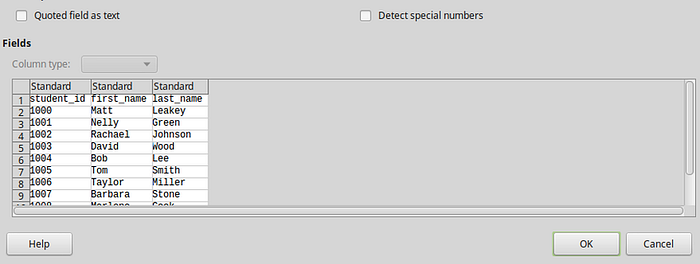
df = pd.read_csv('students.csv')print(df)
The result will be:
        student_id first_name last_name
0         1000       Matt    Leakey
1         1001      Nelly     Green
2         1002    Rachael   Johnson
3         1003      David      Wood
4         1004        Bob       Lee
5         1005        Tom     Smith
6         1006     Taylor    Miller
7         1007    Barbara     Stone
8         1008    Marlene      Cook
9         1009     Marlon    Marlon
10        1010     selene    martin
You can also load data to a CSV using the .csv function. Let's write our data to a CSV file.
The output will be:
,First_name,Last_name,Email
0,Matt,Mckinney,mattneey@gmail.com
1,Harry,ndarray,Harryndarry@gmail.com
2,ete,Wes,petewes@gmail.com
Series
A series is a one-dimensional array that can hold any data type. In simpler terms, a series is a column. Let’s look at how to work with columns.
Let's assume we are working on the following dataframe
          Name Math Calculus Statistics
0       Matt Harry    70       50         56
1  Mckinney ndarray   67       56         78
2        Cathy Matt   63       65         60
3        Leakey Wes   54       55         56
There are two ways of selecting a column, you can use the dictionary[key] format or the dictionary.key format.
If we wish to select the math column, we should have
print(df['Math'])
    #orprint(df.Math)
The result from both print statements should be the same as shown below.
0     70
1     67
2     63
3     54
Name: Math, dtype: object
0     70
1     67
2     63
3     54
Name: Math, dtype: object
The dictionary[key] format is used if the column contains spaces or special characters; for example, if we had a column named physical education, we would select it as shown
df['physical education']Working with Columns
We’ve learned how to select data from a column, now let’s start working with that data; let's store the data from the math column in a variable called math_data
math = df.Math
print(math)
We can also select more than one column as shown below
df_data =df[['Math','Calculus']]print(df_data)
The result will be:
   Math Calculus
0   70       50
1   67       56
2   63       65
3   54       55
Since the data contains more than one column, it’s no longer a series but a dataframe.
print(type(df_data))The output is
<class 'pandas.core.frame.DataFrame'>Working with Rows
To select a row, we use the dataframe. iloc property and pass in the index of the row. For example, to get the row data of the last student in our dataframe, we would do this:
print(df.iloc[-1])The result will be:
Name          Leakey Wes
Math                  54
Calculus              55
Statistics            56
The iloc property will raise an IndexError if you pass an index that doesn’t exist. For example, if you pass 6 as the index
print(df.iloc[6])You will get the following error
raise IndexError("single positional indexer is out-of-bounds")
IndexError: single positional indexer is out-of-bounds
You can also select more than one row, just like we did with columns. But first, let’s add more data to our dataframe. It should now look like this:
Name Math Calculus Statistics
0       Matt Harry    70       50         56
1  Mckinney ndarray   67       56         78
2        Cathy Matt   63       65         60
3     Thomas Thomas   64       75         46
4      Richard Grey   74       65         56
5       Ching Chang   44       55         46
6          Jim Cary   64       65         76
For example, let’s select the data in the second, third and fourth row
print(df.iloc[2:5])The result will be:
             Name Math Calculus Statistics
2     Cathy Matt   63       65         60
3  Thomas Thomas   64       75         46
4   Richard Grey   74       65         56
Adding and Modifying Rows and Columns
So far, we have been able to work with existing data, now let learn how to
- add new data into rows and columns
- rename columns
Add new columns
Suppose we want to add a new column for a new subject, let’s do that.
df['Quantitative Analysis'] = [60,56,78,45,64,78,69]print(df)
Our new data will be:
Name Math Calculus Statistics  Quantitative Analysis
0       Matt Harry    70       50         56                     60
1  Mckinney ndarray   67       56         78                     56
2        Cathy Matt   63       65         60                     78
3     Thomas Thomas   64       75         46                     45
4      Richard Grey   74       65         56                     64
5       Ching Chang   44       55         46                     78
6          Jim Cary   64       65         76                     69
Renaming columns
Consider the following dataframe:
       Product Name   Cost
0  Tony valencia 7047   36.5
1  Tony valencia 6171   28.5
2  Tony valencia 7050   36.5
3  Tony valencia 7056   28.5
4  Tony valencia 6170   28.5
5       Rayban Rb3025  200.0
Let's rename the cost column to cost of goods
df.columns = ['Product Name', 'Cost of goods']print(df)
The table now looks like this:
           Product Name  Cost of goods
0  Tony valencia 7047           36.5
1  Tony valencia 6171           28.5
2  Tony valencia 7050           36.5
3  Tony valencia 7056           28.5
4  Tony valencia 6170           28.5
5       Rayban Rb3025          200.0
Add a new Column using existing data
For the data above, add a column profit equal to Cost*0.4
df['Profit'] = df.Cost *0.4print(df)
Our table now looks like this:
         Product Name   Cost  Profit
0  Tony valencia 7047   36.5    14.6
1  Tony valencia 6171   28.5    11.4
2  Tony valencia 7050   36.5    14.6
3  Tony valencia 7056   28.5    11.4
4  Tony valencia 6170   28.5    11.4
5       Rayban Rb3025  200.0    80.0
Applying Lamba to Rows and Columns
Lambdas are used to perform complex operations with pandas in rows and columns. The syntax for a lambda function is:
lambda args : expressionConsider the dataframe below,
Suppose we want to create a column average showing the overall performance of each student. Create a lambda function average that takes a value and divides it by 3( total number of subjects)
average = lambda a : a/3Now apply the lambda function to the Total_marks column
df["average"] = df.Total_marks.apply(average)The output will be:
This tutorial has covered everything you need to know to get started with the pandas module. For more advanced examples, refer to the cookbook guide.

