Member-only story
How to Setup Chart.js for React and Dynamically Allocate Colors
Why you should use Chart.js as your chart library—and how to make the most of it when you do
Published in
4 min readMay 15, 2019
In this article I’m going to cover:
- Why use Chart.js vs. a competitor
- How to set up and install Chart.js
- How to prepare your data for Chart.js
- How to dynamically allocate colors for your pie chart
Why Use Chart.js?
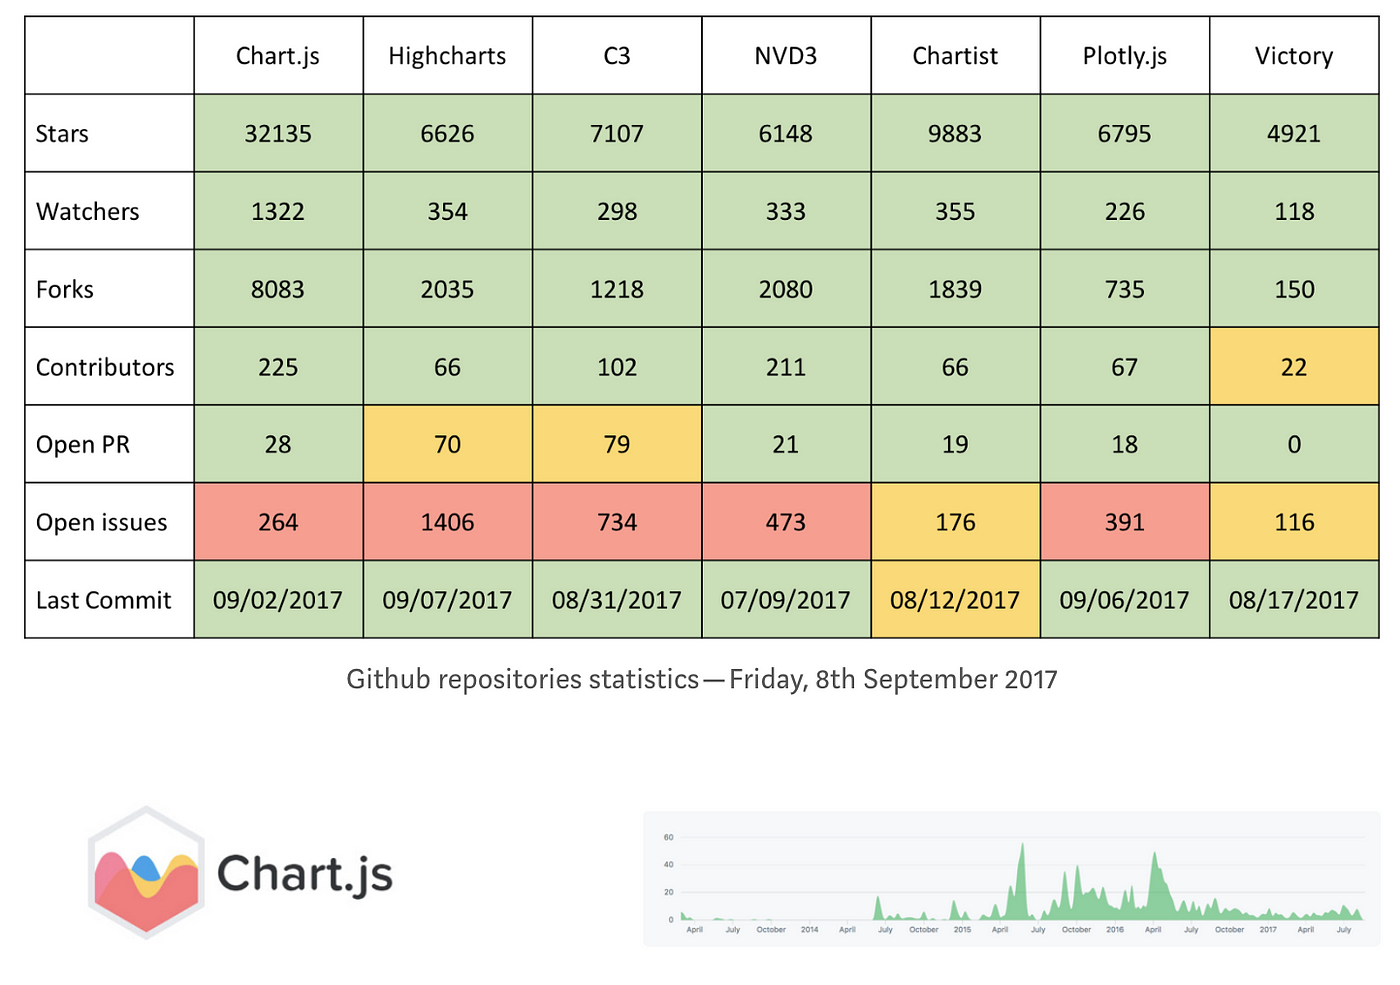
You have many options to pick from when it comes to Chart libraries. I picked Chart.js because it had all the features I needed, is the most popular Chart library, with frequent updates, and has good support for React. If you’re not sure how to pick, I highly recommend this blog article which has synthesized the major pros and cons of different chart libraries with great visuals.
How to Use Chart.js with React
If you haven’t already set up Chart.js, I recommend following this article which outlines the process. In a nutshell:
- Install the library
npm install react-chartjs-2 chart.js --save// ORyarn add react-chartjs-2 chart.js
- Import and use any chart you want:
import {Bar} from 'react-chartjs-2';

< Bar data={...} />
How to Prepare Your Data
Notice the data={...}? We need to prepare our data for Chart.js.
According to the documentation, Chartjs expects your data to look like this:
data = {
  labels: ["January", "February", "March", "April", "May", "June", "July"],
  datasets: [{
    label: "My First dataset",
    backgroundColor: 'rgb(255, 99, 132)',
    borderColor: 'rgb(255, 99, 132)',
    data: [0, 10, 5, 2, 20, 30, 45],
  }]
}labelswill be your X axis labelsdatasetsis an array of objects; Chart.js can display multiple datasets…