Member-only story
How To Monitor Your Machine With One Spectacular CLI Tool — Btop
Do so much more with this all-in-one tool
Have you ever wondered why your computer is slow? Btop may not have the full answer, but it surely shows you potential causes. Maybe one process takes a lot of CPU cycles, or your swap partition is full. You can use tools like ps, df, or swapon for this — or you just use btop and get everything served on a silver platter.
Installation
You can install btop with all common package managers. I tested it with the latest version of Ubuntu and apt using this command:
sudo apt install btopThere is also a snap package available.
Btop is open source. You can install btop directly from the binaries. Check out the repository on GitHub for instructions on this.
Mac users can install btop with homebrew:
brew install btopWindows users are left out in the cold — sorry!
Btop in Detail
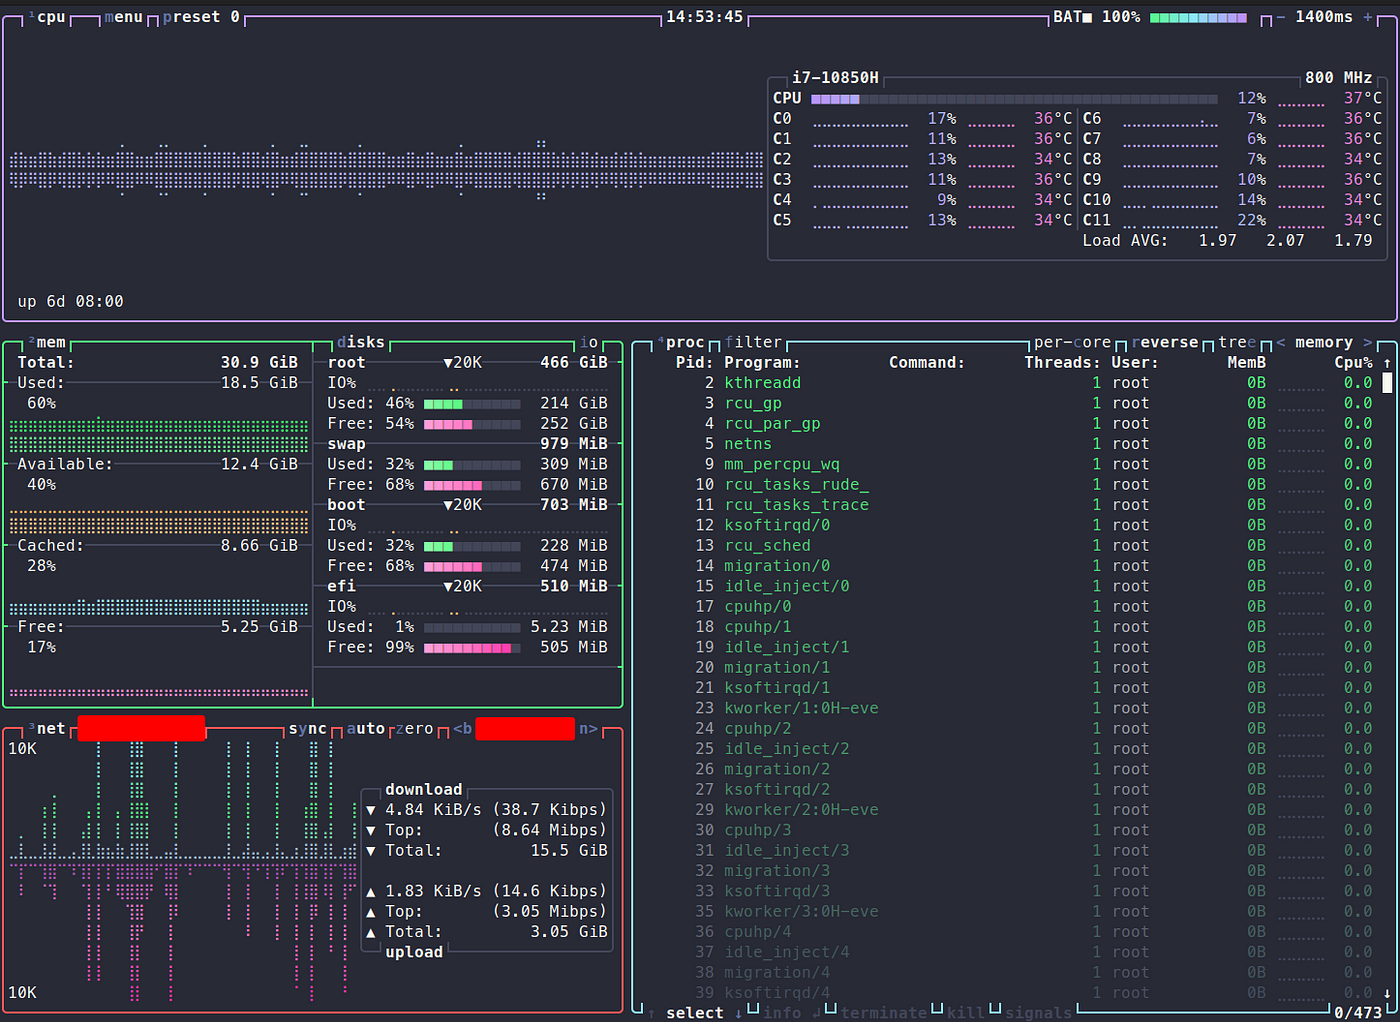
Just run btop in your terminal after installation. It will show you five panels.

The first panel displays information about your CPU usage and temperature. Both are broken down to each core and summarized for the whole CPU. If you use a laptop, btop displays the battery status as well. You can hide the panel by pressing 1.
The second panel shows the memory usage overall and broken down to used, available, cached, and free. You can hide the panel by pressing 2. Used is the memory currently allocated and used by applications. Available is memory allocated by applications.
However, Linux can reallocate this memory if needed. Cached memory contains files from your disk which are cached in the memory for quicker access. Free memory is, well, free. You can find more information here.
Btop shows used and free disk space in panel 3. It is grouped by mount points. Pressing d will hide this panel. You can see the current read and write operations by…

