How To Improve the Jest Performance in CI Environments When Using TypeScript
Tips to rid your projects of stuck test cases and out of memory errors

Every single developer or developer team must make decisions when building a new project, and in this case, we are talking about Node.js projects. When talking about JavaScript development, one of the best decisions you can make is to use TypeScript since this will give you extra tools to write a more clear and maintainable code.
Another good decision is to add a test framework or library to your project, and it’s not a secret that Jest is currently the most used framework and is a good choice since it has a powerful built-in assertion library.
And the last but not least important thing we shall add is a pipeline to ensure we are not introducing errors and everything is working well before each merge or release. Let's use Jenkins for this task, although it could be any other option.
At this point, you have already met the three main characters of this story: TypeScript, Jest.js, and Jenkins. Let’s get started.
The Problem
Everything started because it was asked to update the project dependencies since some vulnerabilities were detected and because it had been a long time since the last update. After this process, I had the following dependencies updated (just to mention the most relevant):
typescript     from 3.9.7  to 4.7.4
jest           from 26.4.2 to 28.1.1
ts-jest        from 26.3.0 to 28.0.5
Then, when I pushed the changes and Jenkins ran the tests, two different issues in two different moments were identified:
- The test stage got stuck at a random test case at every pipeline execution and was never finished.
- After implementing a workaround for the first issue and merging the changes to another feature branch with some extra code and tests, the following error was printed in the stage’s log “JavaScript heap out of memory error.”

Besides that, it’s important to say that before the dependencies update, the test stage took 1.59 minutes for unit tests and 3.26 minutes for the e2e test. Keep these numbers in mind for later.

The Workaround for “Stuck Test Cases”
As you can see in the answers to this Stack Overflow question, the first and most used approach you can find when you look for information about how to fix this problem is related to the number of threads used by Jest to run the tests. You can change the default behavior by using two different options:
— runInBand: This runs all the tests serially and uses the main process rather than creating more threads.— maxWorkers: This allows you to set how many threads can be used to run the tests. This defaults to the number of the cores available on your machine minus one for the main thread.
Therefore, I added the option — runInBand to my package.json test script to avoid Jest running more than one test at a time, meaning the process needs less memory. However, this also means it will take longer to finish. This solved the first issue, but we must deal with the JavaScript heap out-of-memory error.
Digging Deeper, Looking for the Root Cause of “Out of Memory Error”
To have a better understanding of the problem, the first thing that I did, was to get more profiling information from the test execution. I achieved this by updating the test package.json script to the following:
This allows me to run the tests individually and get information about how much memory was allocated after running each test.
At this point, I realized that Jest was consuming more memory than the available in the Jenkins container and that it took a long time to start running the first test.
My first alternative was to speed up the test using SWC, which promises to speed up the compilation up to 20x compared to Babel. However, I had several problems setting it up because it seemed unable to process circular dependencies well.
Then, while googling for another option, I ended up in a ts-jest configuration option called Isolated Modules. In short, it disables TypeScript type-checking resulting in less memory consumption and a lower execution time.
Final Solution
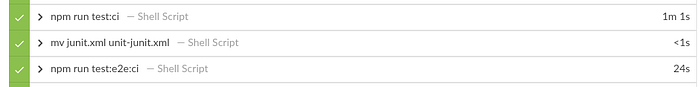
I guess you have concerns about type-checking since we are not using TypeScript to disable it at first. But no worries, we just need to disable it in the CI environment. As you can see in the scripts below, we need to disable the type-checking for the CI script by sending an environment variable. Then you only need to be sure you are using the test:ci when configuring your pipeline.
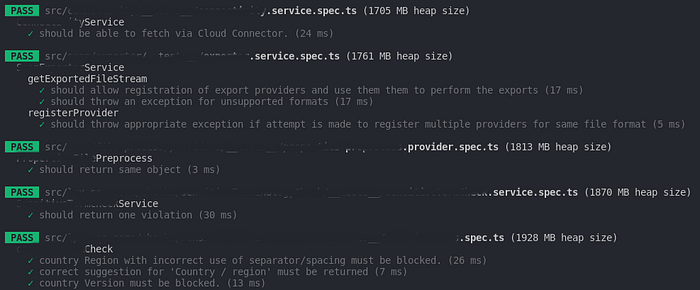
Then let me show you two images of the test execution using the normal test and CI test so that you can see the differences:
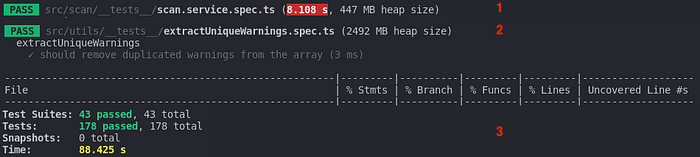
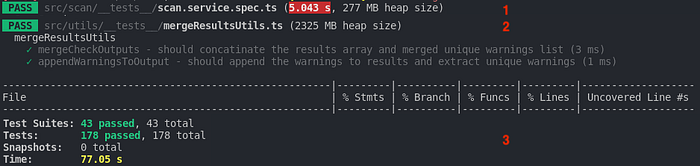
If we look at the three steps in the previous images and make a comparison between each one, we can see the following:
- The first test executed: Startup time and the consumed memory are 3,065s, and 170MB less in the CI script correspondingly
- The last test executed: The final heap size is 167MB less in the CI script
- Execution summary: The execution lasted 11,375s less in the CI script
Finally, let me show you that after the improvement, the tests are running more than 50% faster in the CI environment.
Thanks for reading! I hope that this article has been helpful. All constructive feedback is welcome.