Expected Blocks: Does Shot-Blocking Matter in Soccer?
Training an XGBoost algorithm to predict the number of shots a team would block

My interest in shot-blocking began when I came across a blog post by Chris Summersell. Summersell highlighted Liverpool’s strategy to not block long-distance shots. I was surprised that such a successful team would allow attackers to shoot uncontested from long range.
There is a weak correlation between blocking shots and conceding goals, but that is simply because the more shots you concede, the more you are likely to block them. So blocking shots by itself is not a bad thing. I wanted a way to predict the number of blocked shots, identify teams that are blocking more or less than expected, and investigate the relation to defensive quality.
Method
I trained an XGBoost algorithm (explained here) to predict the number of shots a team would block using nine different variables. The data used to train the model was from Football Reference’s Big 5 European leagues. I used the past four seasons: 2017/18, 2018/19, 2020/21, and 2021/22. I excluded 2019/20 because Ligue 1 abandoned the season due to COVID. The code I wrote for this project can be accessed on my GitHub.
The nine variables I used were: shots allowed, possession %, goalkeeper saves, attacking third touches allowed, non-penalty expected goals allowed, goals allowed, average distance of defensive actions (from own goal), average distance of shots allowed, and own goals.
The feature importance scores, which show how much influence each variable had relative to the others, are displayed below:

I split the data into training and testing sets and used hyperparameter tuning to minimize the root mean squared error (RMSE). Finally, I used the trained model to predict the number of blocks for Europe’s Big 5 Leagues in the current season, 2022/23.
Results
The Expected Blocks (xBlocks) model had a relatively strong correlation with the actual blocks for each team, with about 65% of the variance explained as seen below:

I subtracted the xBlocks for each club from the number of shots they actually blocked to produce Blocks Over Expected (BOE). I plotted BOE with respect to each team’s non-penalty expected goals allowed (npxGA) below:

Analysis
Blocking more or fewer shots than expected doesn’t automatically translate into a better defense. However, we see some of the best clubs in the world at the moment in the top right: Newcastle United, Manchester City, Barcelona, Real Madrid, and Napoli.
Newcastle has the highest BOE in Europe with 31.5 more shots blocked than expected which is 61% better (!!!) than the next closest team, Empoli. This has come alongside the best defensive record in the Premier League and second-best in Europe behind Barcelona.
However, some teams have a better defensive record while blocking fewer shots than expected. Most notably, Inter, who are second in Serie A and in the Champions League Round of 16. Plenty of teams also have a positive BOE with an abysmal defensive record.
Let’s get back to Liverpool, though.
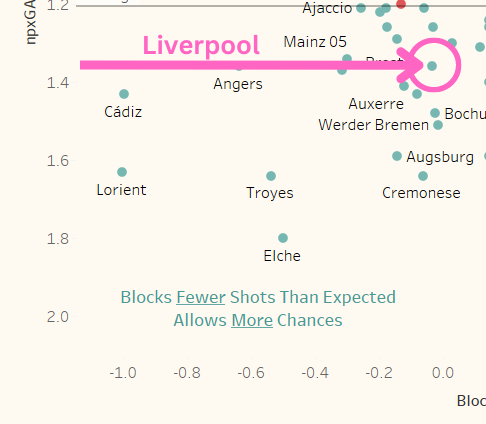
Their previously stellar defense (third-best in Premier League in 2021/22) has fallen off a cliff. But Summersell’s observations still hold true: Liverpool blocked fewer shots than expected.
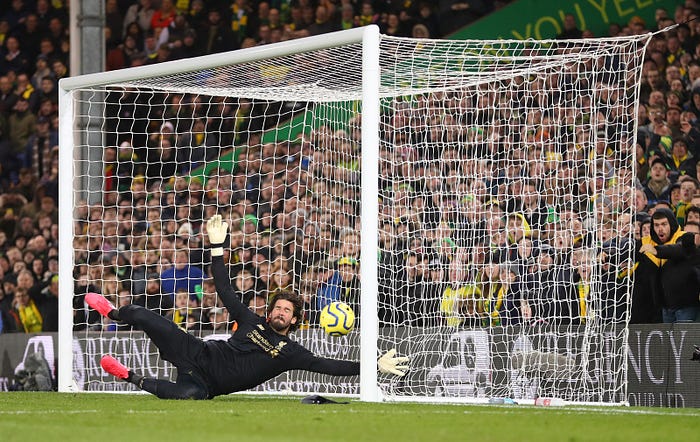
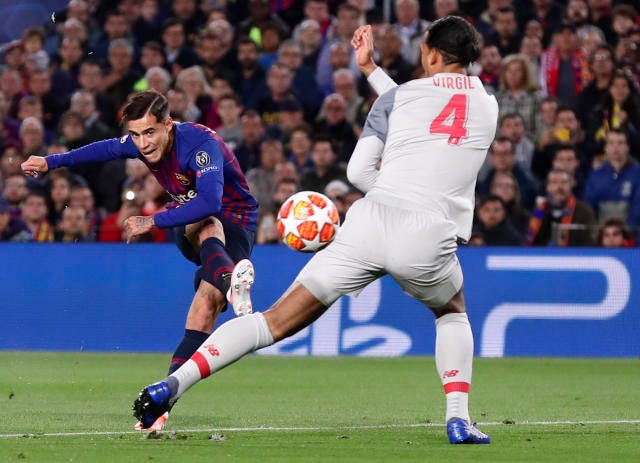
The Reds’ opponents consistently have one of the lowest shot distances to the goal. At the same time, Liverpool isn’t interested in blocking these long-range strikes. Liverpool has the fourth-fewest shots against in the Premier League. Could it be that opponents respect goalkeeper Alisson that much? His Post-Shot Expected Goals +/- is above average in all but one of his five Liverpool seasons.
Whatever the issue is with Liverpool’s defense, it doesn’t seem to be with goalkeeping or blocking shots. For anyone who has watched the games, it’s clear there are structural issues. This season Liverpool’s npxG/Shot conceded, a measure of shot quality, is the worst in the league. Liverpool doesn’t give up many shots, but the ones they do are in dangerous areas.
Conclusion
Defensive stats are still murky in soccer. But, BOE can be a useful framework for categorizing defenses. Knowing a team’s tendencies for blocking shots could be useful for planning how to react to what the defense gives you. Blocking more shots than expected seems to work for many clubs, but if your opponent takes those shots from great positions, you probably won’t be able to block your way to safety.
If you want to play around with the earlier scatter plot, click here for my Tableau dashboard.
For future work, a version of this model trained on tracking data would be the next step to better understand how distance and player positioning affects shot-blocking. Additionally, I’m interested in combining BOE with other defensive stats to try and predict a club’s npxGA.
Thank you to Aaron Moniz for his feedback and Football Reference for the data.
References
Want to Connect?

You can reach me on Twitter @analyticsavi / @avi_rn.
