Debug Go Like a Pro
From profiling to debugging and everything in between

Once you understand the basics, Golang can make you more productive than ever before. But what do you do when things go wrong?
You may not know this, but Go natively includes pprof for recording and visualizing run-time profiling data. Third-party tools like delve add support for line-by-line debugging. Leak and race detectors can defend against non-deterministic behavior.
If you haven’t seen or used these tools before, they will quickly become powerful additions to your arsenal of Golang tools.
Why Don’t I Just Print Everything?
I’ve met a lot of developers who rarely open the debugger when they run into an issue with their code. I don’t think that’s wrong. If you’re writing unit tests, linting your code, and refactoring along the way, then the quick-and-dirty approach can work for a majority of cases.
Conversely, I’ve been in the throes of troubleshooting problems and realized it’s quicker to pepper in some breakpoints and open an interactive debugger than continually add assertions and print statements.

For example, one day I was looking at the memory graph for a web application I helped maintain. Every day the total memory usage slowly increased to the point that the server needed to be restarted to remain stable. This is a classic example of a memory leak.
The quick-and-dirty approach suggests that we read through the code ensuring spawned goroutines exit, allocated variables get garbage collected, connections properly close, etc. Instead, we profiled the application and found the memory leak in a matter of minutes. An elusive, single statement caused it — usually the case for this class of error.
This overview will introduce you to some of the tools I use almost every day to solve problems like this one.
Profiling Recording and Visualization
To get started, let's take a basic Golang web server with a graceful shutdown and send some artificial traffic. Then we’ll use the pprof tool to gather as much information as possible.
We can ensure this works by doing:
$ go run main.go &
$ curl localhost:8080
Hello World!
Now we can profile the CPU by including this snippet:
We’ll use a load testing tool to exercise the web server thoroughly to simulate normal to heavy traffic. I used the testing tool vegeta to accomplish this:
$ echo "GET http://localhost:8080" | vegeta attack -duration=5s
Hello world!
...
When we shut down the go web server, we’ll see a file, cpu.prof, that contains the CPU profile. This profile can then be visualized with the pprof tool:
$ go tool pprof cpu.prof
Type: cpu
Time: Jan 16, 2020 at 4:51pm (EST)
Duration: 9.43s, Total samples = 50ms ( 0.53%)
Entering interactive mode (type "help" for commands, "o" for options)
(pprof) top 10
Showing nodes accounting for 50ms, 100% of 50ms total
Showing top 10 nodes out of 24
      flat  flat%   sum%        cum   cum%
      20ms 40.00% 40.00%       20ms 40.00%  syscall.syscall
...
This is good a good start, but Go can do better. We want to profile our application as it receives traffic, that way we don’t have to rely on simulated traffic or add additional code to write profiles to file. Adding the net/http/pprof import will automatically add additional handlers to our web server:
import _ "net/http/pprof"With that added, we can hit the /debug/pprof/ route through our web browser and see the pprof page teeming with information.
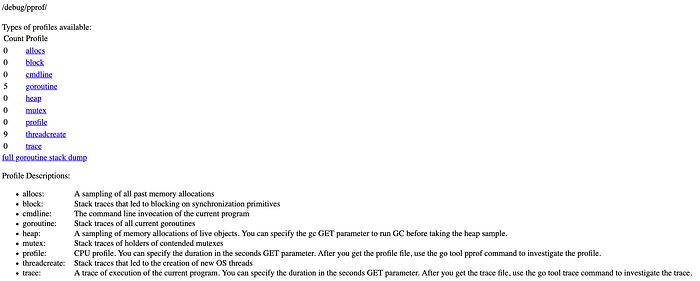
We can get the same information as before by running the command:
$ go tool pprof -top http://localhost:8080/debug/pprof/heapYou can also:
- Generate images based off of the type of profile.
- Create Flame Graphs to visualize the time spent by the application.
- Track Goroutines to detect leaks before they cause degraded service.
Note that for production web servers, we rarely want to avoid exposing this information to the world and should instead bind them to a different internal port.
Delve the Interactive Debugger
Delve is advertised as:
… a simple, full featured debugging tool for Go. Delve should be easy to invoke and easy to use. Chances are if you’re using a debugger, things aren’t going your way. With that in mind, Delve should stay out of your way as much as possible.
To that end, it works really well when you have an issue that’s taking just a little too long to figure out.
Getting started with the tool is fairly easy, just follow the installation steps. Add a runtime.Breakpoint() statement and run your code using dlv:
$ dlv debug main.go
Type 'help' for list of commands.
(dlv) continue
Once you hit the breakpoint you’ll see the block of code, for example in the webserver above I put the it in the handler:
> main.handler() ./main.go:20 (PC: 0x1495476)
    15:         _ "net/http/pprof"
    16: )
    17:
    18: func handler(w http.ResponseWriter, r *http.Request) {
    19:         runtime.Breakpoint()
=>  20:         fmt.Fprintf(w, "Hello World!\n")
    21: }
    22:
    23: func main() {
    24:         srv := http.Server{
    25:                 Addr:         ":8080",
(dlv)
Now you can go line by line using the next or n command or dig deeper into a function using the step or s command.
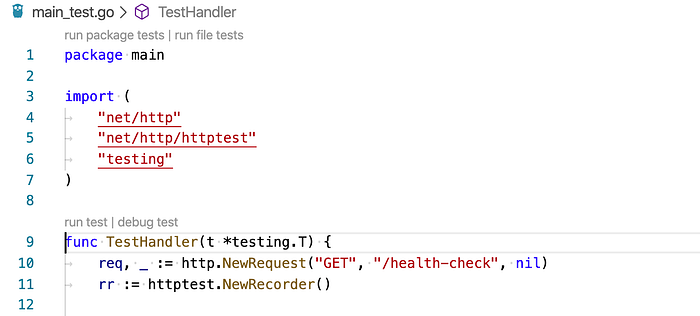
If you’re a fan of a nice UI and clicking buttons instead of using your keyboard, VS Code has great delve support. When writing unit tests using the native testing library, you’ll see a button to debug test which will initialize delve and let you step through the code via VS Code in an interactive session.
For more information on debugging Go code using VS Code check out the Microsoft wiki on it.
Delve can make adding breakpoints, testing assertions, and diving deep into packages a breeze. Don’t be afraid to use it the next time you get stuck on a problem and want to know more about what’s happening.
Leak and Race Detectors
The last topic I’m going to cover is how to add Golang leak and race detectors to your tests. If you haven’t encountered a race condition or experienced a Goroutine memory leak, consider yourself lucky.
In 2017 Uber open-sourced the goleak package, which is a simple tool to check that marks the given TestingT as failed if any extra goroutines are found by Find.
It looks like this:
func TestA(t *testing.T) {
   defer goleak.VerifyNone(t)
   // test logic here.
}
While you’re doing complex asynchronous work, you can ensure that you both avoid regressions and follow the fifth tenet of The Zen of Go:
Before you launch a goroutine, know when it will stop.
Finally, after ensuring you have no Goleaks, you’ll want to protect against race conditions. Thankfully the data race detector is built-in. Consider the example from the race detector’s documentation:
This is a data race that can lead to crashes and memory corruption. Running this snippet with the -race flag leads to a panic with a helpful error message:
go run -race main.go
==================
WARNING: DATA RACE
Write at 0x00c0000e2210 by goroutine 8:
  runtime.mapassign_faststr()
      /usr/local/Cellar/go/1.13.6/libexec/src/runtime/map_faststr.go:202 +0x0
  main.main.func1()
      /PATH/main.go:19 +0x5dPrevious write at 0x00c0000e2210 by main goroutine:
  runtime.mapassign_faststr()
      /usr/local/Cellar/go/1.13.6/libexec/src/runtime/map_faststr.go:202 +0x0
  main.main()
      /PATH/main.go:22 +0xc6Goroutine 8 (running) created at:
  main.main()
      /PATH/main.go:18 +0x97
==================
2 b
1 a
Found 1 data race(s)
While you can use the flag during execution of your code, it’s most helpful to add to your go test command to detect races as you write tests.
Conclusion
These are just some of the great tools available in the Golang ecosystem to aid in observing, debugging, and preventing production failures in your codebases. If you’re looking to go further I recommend taking a look at:
- Distributed tracing like Open-tracing Go.
- Time-series monitoring using a tool like Prometheus.
- Structured logging using logrus.
For more information on any of the tools listed above check out the resources section for full documentation and manuals.