The Art of Logging
Creating a human- and machine-friendly logging format

Historically, logs have been essential for troubleshooting application and infrastructure performance. Nowadays, it is used for business dashboards visualization and performance analysis.
The importance of structuring the data in those log files so it can be extracted, manipulated, and analyzed efficiently, in addition to being understandable by humans, is quickly moving up the priority list. The rise of (micro)services also gave birth to another challenge: tracing the propagation of the request throughout the system.
In this article, we will identify the optimal format for structuring our logs that is easy for humans and machines to parse and understand. Next, we will highlight the key info to log in addition to a proposal of data structure. Finally, we will try to provide some important notes to keep in mind for your own projects.
Why Should Logs Be Human Readable?
Although logs are originally meant to be parsed, processed, and stored by machines, they are actively being read, understood, and diagnosed by humans. Logs are our best indicators to investigate the murder scene caused by our arch enemy: The Bug! 🐛

Nothing can be more frustrating and time-consuming than trying to grasp the information lost within a long and unstructured logline. It is imperative to have a meaningful log that a person can easily understand and dig deeper into if the content is relevant to them.
66.249.65.159 - - [06/Nov/2014:19:10:38 +0000] "GET /news/53f8d72920ba2744fe873ebc.html HTTP/1.1" 404 177 "-" "Debian APT-HTTP/1.3 (0.8.16~exp12ubuntu10.16)"Although we are used to the default Nginx format, the above example is still hard to read and process. It is even harder when it is part of a huge log file extracted in order to reproduce a bug in production, for example.
The advantages of JSON over other data exchange formats, such as XML, become very clear as it’s simple for us humans to read, write, and understand. How? Its structure is a simple syntax of key-value pairs ordered and nested within arrays.
So, what does a log message written in JSON look like? The following is the same previous example of the Nginx web server formatted in JSON:
{
"time": "06/May/2022:19:10:38 +0100",
"remote_ip": "66.249.65.159",
"remote_user": "-",
"request": "GET /news/53f8d72920ba2744fe873ebc.html HTTP/1.1",
"response": 404,
"bytes": 177,
"referrer": "-",
"agent": "Debian APT-HTTP/1.3 (0.8.16~exp12ubuntu10.16)"
}
Why Should Logs Be Machine Friendly?
Let’s consider the above log line example again:
66.249.65.159 - - [06/Nov/2014:19:10:38 +0000] "GET /news/53f8d72920ba2744fe873ebc.html HTTP/1.1" 404 177 "-" "Debian APT-HTTP/1.3 (0.8.16~exp12ubuntu10.16)"In order to make sense of it, we need to:
- decipher the syntax
- write logic to parse the messages and extract the data we need
Unfortunately, that logic is fragile. In case something changes in the log format (like a developer adds a new field or changes the items order), then the parser will break. I am sure anyone can face or relate to a similar situation.
That’s where a structured format such as JSON can help. The key-value pairs make it easy to extract specific values and filter and search across a data set. If new key-value pairs are added, the software parsing the log messages will just ignore those keys it doesn’t expect, rather than failing completely.

The benefits of logging in JSON for machines are:
- It has a structured format, thus facilitating the analysis of application logs and querying each and every field.
- Every programming language can parse it.
Usually, we can aggregate our JSON data in a log parsing system (ELK, newRelic, Datadog, etc.) that gives us powerful reporting, searching, and insights into our data. These tools make it easier to index some fields, thus solving the issues of tracing requests through (micro)services environment.
Which Information To Include?
Here is a list of info we should include in any proper log message. Some elements could be optional. The (o) next to the field name indicates an optional field.
message <string>: this is a human-readable message to describe the situation → easy to read when filtering to have an overview of the content.level <integer>: This is a numerical presentation for the priority level (more details in the next section). Very useful to sort messages into different buckets of priority or to generate a dashboard with an overview of the system.level_name <string>: This is a “string” presentation for the priority level (more details in the next section)datetime_iso <DateTime>: This is an iso8601 format. It is a required field because we need it to correlate it with other events. Although we can use the server’s date-time, this could be misleading because these servers will use their server acquisition time of the logs which could be a few seconds different or even at a different timezone.correlation_id <string(uuidv4)>: this is an important field for the microservices environment. We will use the correlation id of the parsed message/request to trace a request in the whole journey between services.- (o)
hostname <string>: Useful to identify which machine generated this log. We recommend it in a microservices environment. It could be redundant when the server log maps already the original host from the docker’s service name. - (o)
build_id <string>: this being the version of the software that logged the message. It can help track down incompatibility issues, especially those that happen during the deployment of server-side software. - (o)
application<string>: Useful to identify which device or application generated this log. - (o)
owner_id <string(uuidv4)/null>: this will report the user id or API key id if available. We can trace which steps a user has done to reproduce his actions. - (o)
tenant_id <string(uuidv4)/null>: this will report the tenant id if available. Very helpful for multi-tenant systems - (o)
tags <string[]>: Could be an array of elements. This element contains meta info about a request like the type, used protocol, etc. - (o)
stacktrace: <string/null>: this is used to display the stack trace in a stringified online format if it exists - (o)
exception: <string/null>: this is used to display the exception message if it exists
Log Levels and Associated Log Codes
The Proposed Format
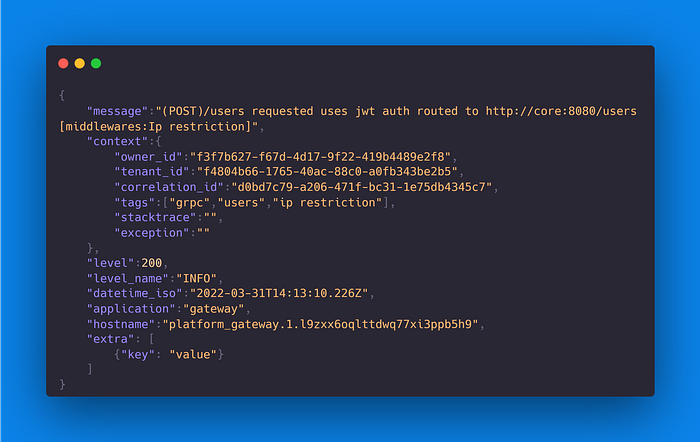
So what does a log message written in JSON look like?
The following is the proposed logging concept format through a sample log:
Observations
- In the log server, we should index the following elements for faster search:
owner_id,tenant_id,correlation_id,level,level_name, andapplication. - The optional fields should be added to the logs when they are available. We can only omit them when they are not available. Their value will be visible when debugging our system.
- The context element can contain other fields that can be useful (like a dump of the incoming request).
- For security or compliance reasons (personal information protection), the logs should have some filters for key fields possibly present in a request (password). We should anonymize the content before outputting it.
- Every service should forward the
correlation_idit is receiving. If this value is not present, it should generate a new one and pass it to the next service. An API gateway (when existing) should always take care of the presence and generation of this field.
Best Practices
- Invest time in designing your log structure. This format serves our needs and can easily be replicated. However, some teams might need a different one. Consider also the level of granularity that suits your needs. Usually, an internal “logging concept” article within your company can rally all teams to follow one pattern. It will be worth the time spent when onboarding new developers to your system.
- Log as much as possible. Having the module and line number during a fatal exception or the IP/username when confronting a security breach is invaluable to resolving the issue faster and more accurately. You can still tune down the verbosity if you want to avoid some unwanted noise. Use a return of experience approach to get the perfect level for you!
- Keeping consistency is everyone’s priority. Proper keys and accurate values in the JSON message make debugging easier and more efficient. Correlation Id and log levels are the obvious components to prove this point.
- Log as you code. Like writing unit tests, try keeping the same discipline and log your system interactions. It is easier to do it on the spot than to add it later to avoid losing the context and edge cases of the function.
Final Notes
- This story is not a push for a standard but rather an attempt to create a logically organized log format optimized for log parsing systems like newRelic or ELK, etc. It will help you generate useful dashboards, metrics, and event notifications (for example, trigger an alert if the percentage of errors exceeds 5%).
- Implementing a standardized log system in your applications will cost you time and money. Debugging will cost you too, especially in edge cases where information is key. Your decision should consider both sides of the equation.
- Logging is a very opinionated and sometimes divisive conversation. However, no matter which format you will use, it is always better than no logs at all.
- I would recommend using asynchronous logging to avoid performance issues.
Acknowledgment
I wanted to give a big shout-out to the tech team of EQS Group for building such a great concept to be shared with the world.
More from similar topics? Check out the following publication:

