Create a Zero-Downtime Deployment of Your Machine Learning API
Swap out old models for new ones whenever you want without skipping a beat

One of the things that make Machine Learning APIs unique is that the underlying models need to constantly be retrained as new data comes in. This leads to frequent re-deployments, and as a consequence, frequent downtime.
In this article, I’ll be walking you through a solution that gets around this problem. The following GIF shows that solution in action. On the left is the API server that is running the (re-)deployment script. On the right is the client that is constantly pinging that API:

The API never returns an error even though the deployment script is running live on the server!
The code for this can be found on my GitHub. It is actually part of a template project that I am developing. More on that soon.
Blue-Green Deployments
The solution I have come up with is inspired by a technique called blue-green deployments.

The basic idea is simple: You spin up the container with your new model and wait until it’s ready. Then, your load balancer diverts traffic from the old deployment (blue in this animation) to the new deployment (green).
The rest of this article will explain how this is achieved, including the technologies used and the relevant code from the template project.
The Load Balancer — Traefik Proxy
Most people automatically use Nginx for load balancing, but the free Nginx load balancer is not able to dynamically detect changes in downstream servers. This is a problem for us because it makes the last step of the blue-green deployment strategy impossible.
That’s why we’ll be working with an alternative called Traefik Proxy.
Basic abstractions
Before understanding how Traefik solves our problems, we need to familiarize ourselves with its underlying abstractions.
This paragraph and the subsequent diagram (both taken directly from the Traefik Proxy documentation) give a nice starting point:
“When you start Traefik, you define entrypoints (in their most basic forms, they are port numbers). Then, connected to these entrypoints, routers analyze the incoming requests to see if they match a set of rules. If they do, the router might transform the request using pieces of middleware before forwarding them to your services.”

The diagram above can conceptually be further divided into two parts, each of which is configured separately.
Entry points are a part of the static configuration, while the routers and services are defined in the dynamic configuration. This means that you can add and remove routers and services on the fly, and Traefik will make sure that traffic always flows appropriately.
In terms of blue-green deployments, this means that we can bring up the green containers and bring down the blue containers without having to re-initialize Traefik. Since the downstream containers are part of the dynamic configuration, Traefik will automatically register those changes for us.
Let’s understand how this is achieved step by step.
Static configuration
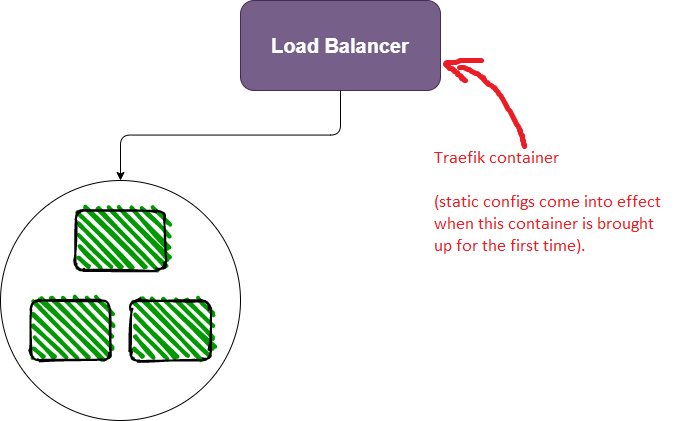
The Traefik load balancer is brought up in a container of its own. This is the docker-compose service that describes how to create that container:
The entries under the command key constitute the static configuration. These come into effect when Traefik is brought up for the first time and can’t be changed later.
The complete list of possible static configurations can be found in the docs. If you go through the list, you’ll notice that there are no configuration options for routers or services. This is because those are dynamic components.
If you go down even further, you’ll start seeing configs for something called providers.

Providers and dynamic configuration
Providers are what make dynamic configuration possible in Traefik. The documentation elaborates on providers under the Configuration Discovery heading:
“Providers are existing infrastructure components, whether orchestrators, container engines, cloud providers, or key-value stores. The idea is that Traefik will query the providers’ API in order to find relevant information about routing, and each time Traefik detects a change, it dynamically updates the routes.”
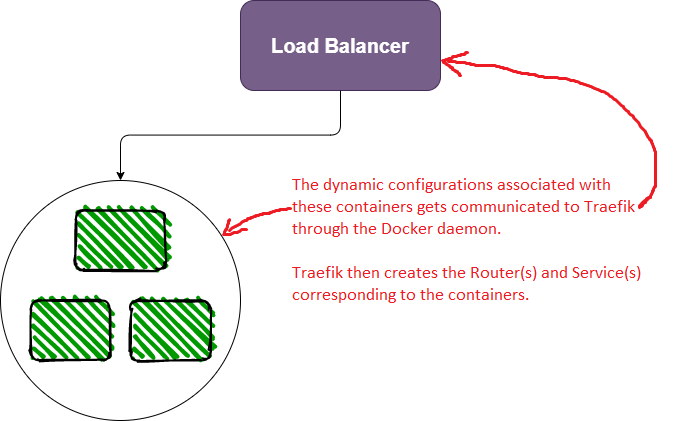
In our case, the provider is the Docker daemon (if you go back up to the static configuration, you’ll find the entry providers.docker=True). Traefik communicates with the Docker daemon to gather information about active Docker containers.
So how do we translate between Docker containers and Traefik concepts like routers and services? Well, as a starting point, we have this guarantee from the documentation:
“Traefik creates, for each container, a corresponding service and router.”
To specify the configurations for that service and router, we use Docker container labels. Take a look at the service definition from the docker-compose.yml file:
The dynamic configurations are all provided under the labels key. Traefik uses them to dynamically create routers and services. The full list of dynamic configuration options can be viewed in the docs.
Dynamic configuration details (can be skipped): loadbalancer
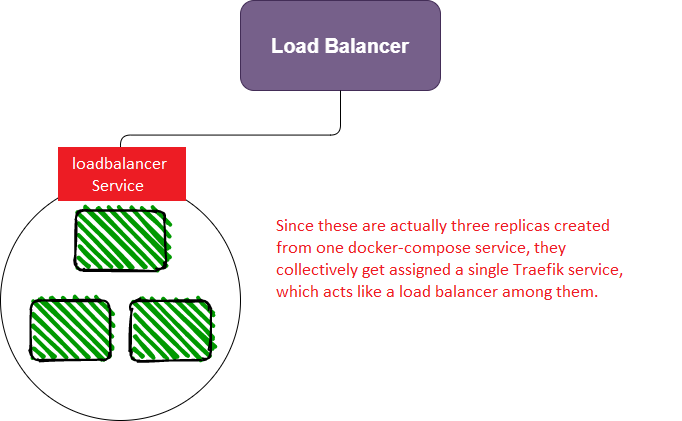
You’ll notice that all of the dynamic configuration keys have loadbalancer in them. This is because it is possible to deploy many replicas of a single container (using the --scale option of the docker-compose up command). So, Traefik automatically configures the service corresponding to a container (or a set of replicas) as a load balancer.
Dynamic configuration details (can be skipped): healthcheck
Each container takes some time to prepare itself and get its API ready. To avoid sending requests to a container that isn’t ready yet, Traefik allows you to configure health checks. From the documentation:
“Traefik will consider your servers healthy as long as they return status codes between
2XXand3XXto the health check requests.”
I’ve added a health check endpoint to the API at the end of theapp.py file:
Since it is the last endpoint defined in the file, we can be sure that if the /health endpoint is responding, all other endpoints and resources have been initialized successfully.
A Walkthrough of the Deploy Script
With that background, let’s go through the deploy script line by line and understand the entire process.
Initial setup
First, the setup:
I’ve designed the deployment so that all the containers are deployed on a single Docker network, deployed-containers. If we are deploying for the first time, a number of resources get initialized:
- First, the Docker network (
deployed-containers). - Then the reverse proxy (Traefik). This is done in the line
docker-compose up -d reverse-proxy. This will load the static configuration shown earlier and set up Traefik to monitor changes from the Docker daemon. - Finally, we need to initialize a file called
.colorsthat keeps track of the color of the current/next deployment. I’m borrowing the idea of a colored deployment from blue-green deployments. This is an example of what the.colorsfile would look like at the beginning of the deployment that we will be running through:
export DEPLOYED_COLOR="blue"
export IDLE_COLOR="green"
Bringing up new (green) containers
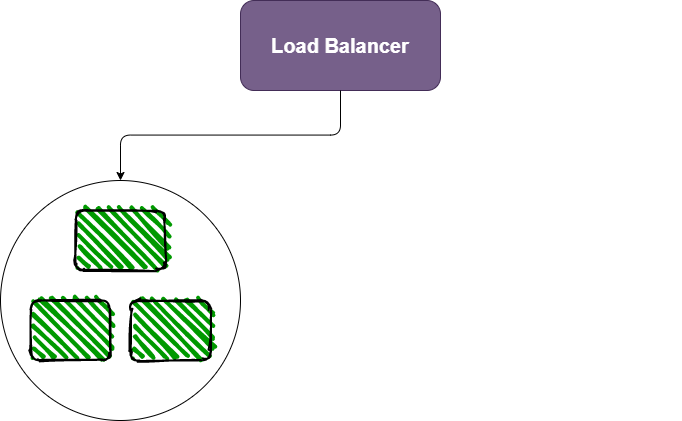
In the beginning, things will be in this state:
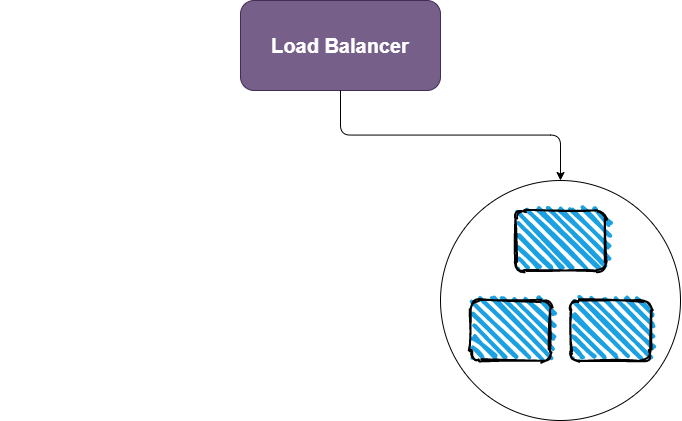
We will begin by bringing up the green deployments:
There are two things to notice here:
- The
— scale model=$REPLICAS. It tells docker-compose to build$REPLICASreplicas of the “green” deployment. - The
— p $IDLE_COLOR. It is used to specify a project namespace todocker-compose. This is important for isolating the green and blue deployments from each other.
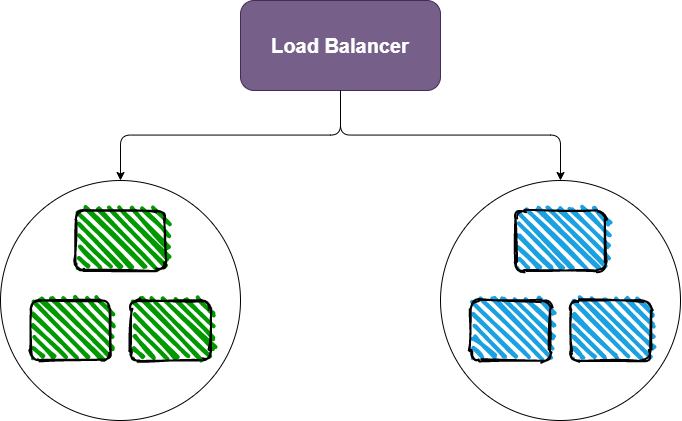
That will bring us to this point:
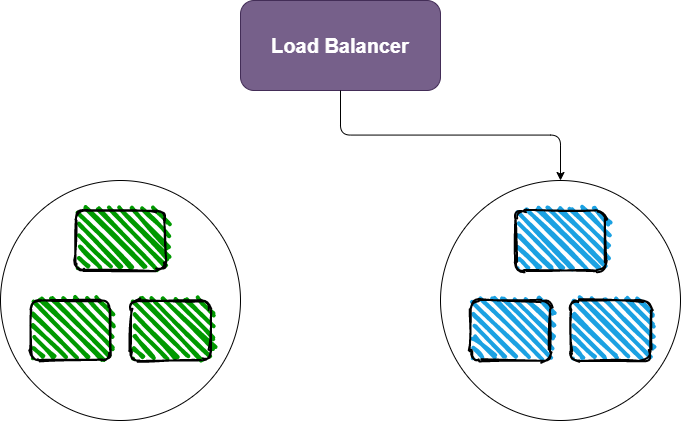
Once the green deployments are ready (i.e. once the health checks are passing), Traefik will start sending traffic to those green deployments as well. Then we’ll be in this state:
Bringing down old (blue) containers
The next step is to bring down the blue containers. We have to do this manually, but only after the green containers are ready. Unfortunately, there’s no way to ping the health endpoints of the green or blue containers individually from outside of Traefik.
To get around this, I created a /deployment_color endpoint in the API. Using it, we can ping the Traefik load balancer and determine the color of the container that responded. As soon as we get a green response, we will know that the green containers are up and we can proceed to bring down the blue containers:
Remember how we isolated the blue and green containers into separate namespaces using the -p flag of docker-compose? That now allows us to bring down the blue containers without affecting the newly deployed green containers. Here’s a demonstration of the process on my local machine:

So after bringing down the blue containers, we will have arrived at our desired final state:
Cleanup
The only thing left to do now is to reset the values in the .colors file:
And to clean up any dangling resources:
Final Demonstration
Here’s a final demonstration of the re-deployment process run on a Linux server I rented from Digital Ocean:
And that’s zero-downtime deployment for you! Thanks for reading.
Resources
- https://github.com/RishabhMalviya/ml-deployment-template
- https://doc.traefik.io/traefik/routing/overview/
- https://doc.traefik.io/traefik/reference/static-configuration/cli/
- https://doc.traefik.io/traefik/reference/dynamic-configuration/docker/
- https://github.com/RishabhMalviya/ml-deployment-template/blob/master/deploy.sh

