Create a Flame Graph for Your Node.js App
Profiling and graphing your app

Creating a flame graph of your Node.js app is pretty simple and easy to learn.
Let’s learn about flame graphs.
What is a Flame Graph?
A flame graph is a type of visualization of the code paths that need to be identified quickly and should be accurate. It can be generated by using any profiling tools. There are many types of flame graphs, like CPU, memory, off-CPU, etc. Here we will learn about the CPU flame graph.

How to Create a Flame Graph?
To create the flame graph, we need to follow the below steps:
Step 1: Create a small node app
To create this small app, create two files in the same directory with name app.js and package.json and paste the code inside the specific file aspackage.json:
app.js:
Step 2: Go to the project location and run below command
npm installagain run below command to test the app:
node app.jsIf you can see the message “go to http://localhost:8080/ to generate traffic” it means your app is running and ready to move on the next step.
Step 3: Install Flamebearer globally by using below command
npm install -g flamebearer
or

Step 4: Go to the app location and run below command to profile your app
node --prof app.js
Step 5: Open a browser and go to http://localhost:8080/
Now you need to open a browser and hit the given URL to hit some APIs to your server. After opening http://localhost:8080/ you can see there are so many hits to your server:

Step 6: Check your log file in your app directory
After running the command node — prof app.js, you can see that there is a log file with a name like isolate-XXXXXXX.log (here isolate-0x102804400-v8.log) will be created.

And this isolate-XXXXXXX.log file should have codes.
This file creation and its code shows that you are in the right direction.
Step 6: Generate flamegraph.html from a V8 log using below command
Open a new terminal and go to the app location and hit the below command (remember the other terminal where you run the command node — prof app.js will still be running).
node --prof-process --preprocess -j isolate*.log | flamebearer
After running the command node- -prof-process — preprocess -j isolate*.log | flamebearer, it should generate the HTML file with the name flamegraph.html. You can see this file in your project directory as:

And this flamegraph.html should contain HTML codes.
Open it manually if it's not opened automatically (as you run the above command the file flamegraph.html will be created and will be open in any browser).
Step 7: Magic! Flame graph created
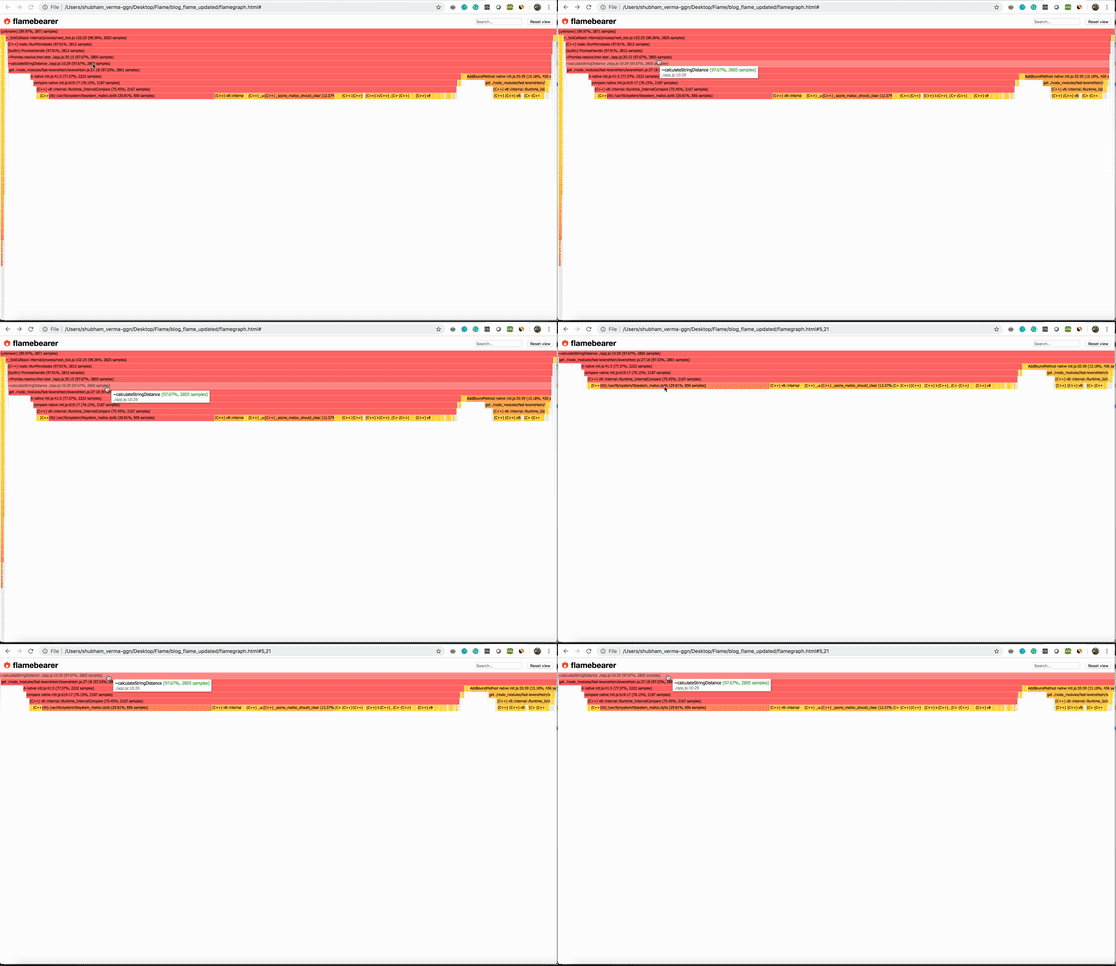
Now our flame graph is created and its time to analyze:

You can see our function calculateStringDistance is showing its profile with the file name based on the number of sampling.
Let’s know this graph carefully:
- Each box in the above image represents a function in the stack (a stack frame).
- The y-axis (horizontal box) denotes stack depth (number of frames on the stack). The top box shows the function that was on-CPU.
- The x-axis (vertical) spans the sample population.
- The width of each box shows the total time it was on-CPU or part of ancestry that was on-CPU (based on sample count). It means functions with wide boxes may consume more CPU per execution than those with narrow boxes or may simply be called more often.
This visualization was called a flame graph, as it was first used to show what is hot on-CPU and it looked like flames.
Click on a specific box to know the details:

After clicking:

Search the function and click on it:
In this flame graph, you can search (in the upper right corner) a function and click to see the details chart of this particular function as:

Now using this flame graph, you can see where CPU time is statistically spent on your app/code/function, and you can optimize the code.
Congratulations! You are becoming an expert in node.js.
Thanks for reading. Keep reading—keep getting.

