Create 3D Graphs on iOS With Plot3d
Build beautiful visualizations for your users
Plotting data in three dimensions can be a great way to visualize data if the data is plotted nicely. It can take creativity and brute-force iterating to come up with a useful plot of data in three dimensions.
On iOS, plotting in three dimensions is even more challenging because there aren’t many frameworks out there to use— and the only ones I found were not free!
Plot3d is an open-source project I have been working on for plotting data in three dimensions on iOS. Plot3d is available on CocoaPods.
How It Works
Plot3d uses SceneKit to represent data in three dimensions. The next two sections will briefly summarize the frameworks.
SceneKit recap
In SceneKit, an SCNScene is where everything that is 3D lives. Any visual object in a scene is an SCNGeometry.
A Geometry is attached to an SCNNode, which is a structural element of a scene, representing a position and transforms in a 3D coordinate space.
Plot3d overview
Plot3d provides a PlotView to manage a scene that contains all of the nodes and geometries needed to plot data in 3D. A PlotView is a subclass of UIView and everything in the scene is added to a PlotSpaceNode.
A PlotSpaceNode is the root node of a scene in a PlotView. Most of the 3D work is handled by a plot-space, which is hidden from the developer.
The data to be plotted in a plot-space is determined using a data source and delegate pattern similar to how a UITableView works.
Using Plot3d
To get started, just create a view with a given configuration, and then provide data. All of the code below is assumed to be in a UIViewController.
Creating a PlotView
Initialize a PlotView with a custom configuration, and set axis titles to get started.
Plotting in 3D
A plot space plots data using a PlotDataSource and a PlotDelegate. Since a PlotSpaceNode is not exposed, the data source and delegate are assigned through the PlotView.
To plot data, extend the view controller to implement the data source and delegate protocols and then assign them to the plot view.
plotView.dataSource = self
plotView.delegate = self
plotView.reloadData()
PlotDataSource
The data source is used to specify the number of points to plot and connections to make. The underlying plot space will iterate through the given amounts and plot each point and connection accordingly.
PlotDelegate
Below are some of the delegate methods that can be implemented to provide data to the plot space.
- Provides a
PlotPoint(a 3D coordinate) for each point to plot. (Implementation is required.) - Provides the geometry to use at each plotted point. (Implementation is required.)
- Provides the
PlotTextto use at each tick mark. (Implementation is optional.)
Adding connections
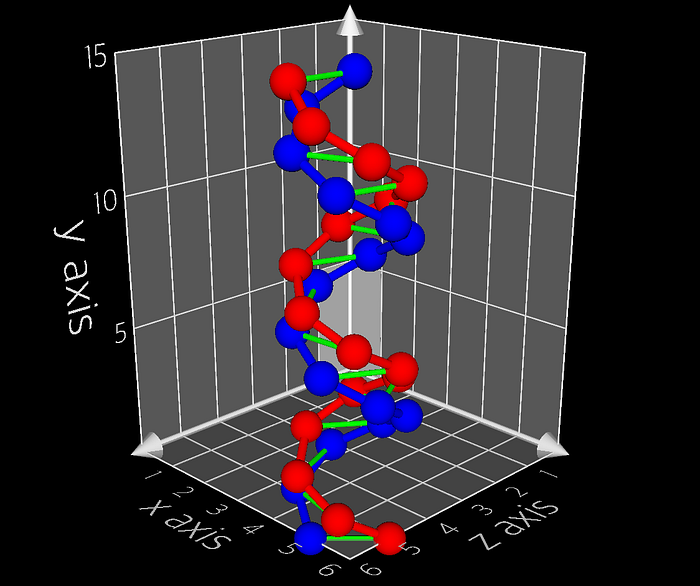
We can take things one step further by adding connections between plotted points to help make the data easier to visualize.
Adding the following code to the PlotDataSource will specify the number of connections to make.
Adding the following code to the PlotDelegate will specify which points to connect, and how each connection should look.
End
The goal of Plot3d is to make it easier to develop 3D visualizations of data on iOS.
I’ll admit that there may not be a huge demand for 3D graphs on iPhones, but now I can sleep easier knowing there is an open-source option for developers. You can check out the source code on GitHub.

