Building Custom Data Visualizations With Datadog UI Apps
How to create a custom GeoMap widget in Datadog

This post is the second part of a two-part blog post series. In the first part, we looked at Crystal, a programming language that offers the performance of C/C++ and the readability of Ruby. We used Crystal to create a proxy server that retrieves geolocation coordinates related to IP addresses. In this second part, we will see how to take advantage of a Datadog application to create a custom Geomap.
To follow this blog post, you will need some basic knowledge of programming and monitoring. Knowledge of Datadog can be useful but is not required. The UI App we will create will use React and TypeScript. We will analyze each of the code snippets together.
You can find the whole project code on this Github repository and follow the installation steps in the readme.
At the end of this post, you will have at your disposal a custom Geomap Widget displaying a marker related to geographic coordinates, in other words latitude and longitude. You will also be able to create your own custom widget in Datadog thanks to an UI App and listen to events related to the SDK context switch.
Let’s get started!
It all started with a customer’s pain point…

Our story starts with a customer and a feature request: this customer wants to display data from Datadog Audit Logs on a Geomap widget. Well, for the neophyte who doesn’t necessarily know Datadog and its features, this is the moment of definition, because the terms Audit Logs or dashboard widgets don’t necessarily speak. So let’s take it step by step!
Dashboards are one of Datadog’s essential tools: they allow you to display, track, and follow key data to monitor the health of your infrastructure. Each dashboard is composed of widgets. You have Distribution widgets, Event Stream widgets, Heat Maps widgets, and also geomaps widgets.

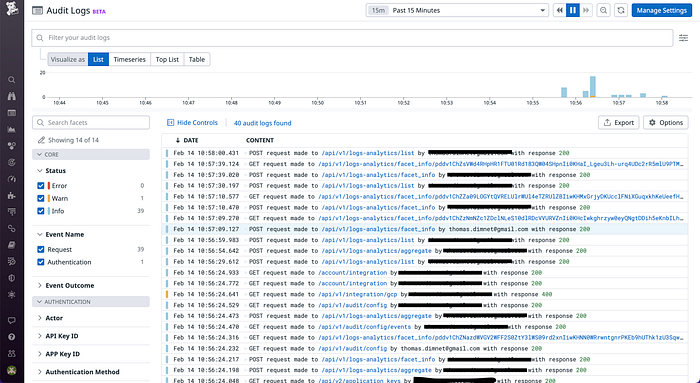
Now let’s take a look at Audit Logs. Audit logs allow you to know who is using Datadog in your organization and how. Thanks to Audit Logs, you will, for example, be able to know who has modified an important dashboard or monitor and for what reason. If you are familiar with AWS, Audit Logs can be compared to CloudTrail. With Audit Logs, you will be able to retrieve information such as the actions performed (it’s a log after all), the type of event, its status but also the IP address and email of the user who performed this action.
That’s it for the definitions, I told you would be quick! You should now be able to decipher the initial statement: “This customer wants to display Datadog Audit Logs data on a Geomap widget”. By the way, you should even point out that there are already Geomap widgets (since I mentioned them a little earlier!)
Yes, there is already a Geomap widget

So what’s the problem with the existing Geomap widgets? Service and data incompatibility!
In fact, to use the geomap widget, you need the Real User Monitoring service, or RUM as its nickname. This service provides you with end-to-end visibility into your users’ activity and experience in real time. In other words, thanks to RUM, you will be able to monitor the performance of your web pages, error management, and the use of your product. RUM works on the “client” side, i.e. browsers and iOS or Android applications. To display this geomap widget, you also need precise data: the ISO code of the country; this ISO must correspond to the alpha-2 ISO format.
The problem is that in our case, the customer wants to use another service: Audit Logs. Furthermore, the customer wants to get the latitude and longitude of their users from their IP address. This geolocation will then be displayed in a Geomap.
Retrieving geographic information based on IP addresses and displaying this information on a map

If you haven’t already done so, you can clone the project from this Github repository and launch it with Docker and docker-compose. Note that you will need a Datadog account with an API key and an application key. The project contains three folders:
crystal-apiwhich corresponds to our Proxy in Crystal. If you want to come back to it, feel free to come back to this blog post. This proxy will run on the 8080.datadog-app, our Datadog application which contains our custom widget. The application will run on port 3000.setup, which is a set of installation scripts. These will not only create your Datadog application and configure it but also create a dashboard with widgets inside.
You can test the proxy with this CURL request:
curl --location --request GET 'http://localhost:8080/json?ip=8.8.8.8'And this is what the proxy returns:
The gif below shows you the project in action. On the left side, you have traditional Datadog widgets: two tables and a time series. The right part is our Datadog application. Visually, there is no difference between the two.
To change the location of the map and the marker, we go through the template variables. These are useful to filter one or more widgets of the dashboard. Here, we use template variables on users’ email and IP addresses. This data is then retrieved by the UI Apps client and injected into our Geomap widget.
Building a custom Geomap Widget
If you don’t have a clear idea of what an UI App in Datadog is yet, you should know that it’s a feature that allows developers to extend Datadog’s native functionality through custom widgets, modules and side panels. In other words, it means you can now run arbitrary JavaScript code directly in your dashboards. Let’s say you want a data visualization that Datadog doesn’t support, a Geomap for example, you can write an application to extend that functionality into Datadog.
To discover how to initialize a Datadog application, I invite you to look at the official documentation or at another of my articles dedicated to the creation of a Datadog App on Redis. These two resources will not only make you create your first Datadog application but also your first custom widget and your first modal. Indeed, the idea here is to focus on how to display the geomap and markers on it. You can open the file : geomap/datadog-app/src/widget/GeoMap/index.tsx
If you know TypeScript or JavaScript, you should already be familiar with this part. Note that the SDK of the application is imported and then initialized via the ui-extensions-sdk library. In addition, the ui-extensions-react library is used to retrieve the useTemplateVariables hooks.
We will then define our hooks. The first one is the geographic coordinates. Since the widget is written in TypeScript, we need to create an interface. The second hook comes from the library imported above and allows us to retrieve the IP addresses from the client.
Then, we will add a life cycle to our application. Each time the ip Address state will change, we will make an API call to retrieve the geographical coordinates. This data will then be integrated to a local state via the setLocation method.
Finally, if we have the latitude and longitude, we display the map with the GPS coordinates and a marker. Otherwise, we don’t display anything. In less than 60 lines of code, we are able to create a custom Geomap!
Now that you’ve seen how to create a custom data visualization, the next step will be to look at how to distribute it to as many people as possible by submitting it to Datadog. The good news is that I’m writing a blog post about it! Anyway, I hope you enjoyed this series of two articles and I’ll see you for future adventures (with a little Crystal).

