Attach a Visual Debugger to ML-training Jobs on Kubernetes
As machine learning models grow in size and complexity, cloud resources are more and more often required for training. However, debugging training jobs running in the cloud can be time-consuming and challenging. In this blog post, we’ll explore how to attach a visual debugger in VSCode to a remote deep learning training environment, making debugging simpler and more efficient.

Debugging locally may not always be possible or practical when training deep learning models, for instance when the debugging requires GPUs/high computational resources, access to data that may not be available on your notebook, or access to a distributed multi-node training environment.
When debugging training jobs in the cloud, many machine learning engineers resort to iterative print debugging as a means of troubleshooting. Adding print statements to the code to identify where an error may be occurring and restarting a remote execution, however, can be inefficient and time-consuming.
Attaching a visual debugger to a remote training job can help overcome these limitations.
In this tutorial, we will explore how this can be done with VSCode at the example of a simple Flyte training workflow we run in a local Kubernetes cluster. The tutorial does not require access to any cloud resources. The method works exactly the same in a managed cloud Kubernetes cluster like GKE — or also without Kubernetes, as long as you can port-forward a service to your notebook’s localhost, for instance via ssh from a GCE/EC2 virtual machine.
Setup
Create a local Kubernetes cluster
To create a local Kubernetes cluster we use k3d. We also create a local docker image registry the cluster has access to:
k3d registry create registry.localhost --port 6000

k3d cluster create -p "30081:30081@server:0:direct" -p "30084:30084@server:0:direct" --no-lb --k3s-arg '--no-deploy=traefik' --k3s-arg '--no-deploy=servicelb' --registry-use k3d-registry.localhost:6000 sandbox
(Note that we port-forward the ports 30081 and 30084? This will be required later on to access our MLOps workflow orchestration engine.)
Deploy an MLOps workflow orchestration engine
For this tutorial we use the Kubernetes workflow orchestrator Flyte which is 1) fully open source, 2) battle tested at massive scale at Lyft (original creator) and Spotify, and which 3) in my opinion is the most powerful and mature choice there is today.
Let’s install it into our newly created local cluster (helm installation guide):
helm repo add flyte https://flyteorg.github.io/flyte
helm repo update

helm install -n flyte flyte-deps flyte/flyte-deps --create-namespace -f https://raw.githubusercontent.com/flyteorg/flyte/master/charts/flyte-deps/values-sandbox.yaml --set minio.service.type=NodePort --set contour.envoy.service.type=NodePort
helm install -n flyte -f https://raw.githubusercontent.com/flyteorg/flyte/master/charts/flyte-core/values-sandbox.yaml --create-namespace flyte flyte/flyte-core
The helm install commands might take a minute to complete. You can observe the progress with watch kubectl --namespace flyte get pods (watch being optional). Ultimately, all pods in the flyte namespace should be running - give it a minute or two until all errors like Init:Error or Init:CrashLoopBackOff have disappeared:

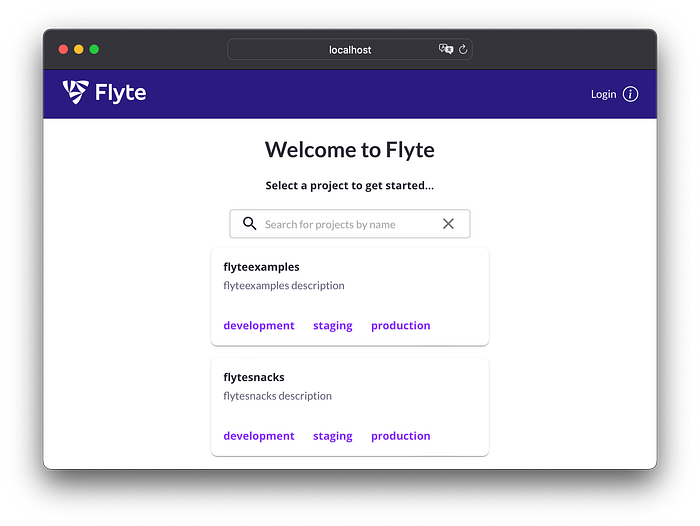
At this point, the so-called Flyte-Console should be available at http://localhost:30081/console (remember we forwarded this port during the cluster creation).
In your current working directory create a configuration file called flytekit.config:
[platform]
url = localhost:30081
insecure = True
Remote debugging
Create a workflow to debug
Let’s create a minimal working example workflow which prepares a dataset, trains a simple model, and finally evaluates it. I adapted this random forest classifier for the iris dataset:
import logging
from typing import Tuple

import joblib
import pandas as pd
from flytekit import task, workflow
from flytekit.types import schema  # noqa: F401
from flytekit.types.file import FlyteFile
from sklearn import datasets, metrics
from sklearn.ensemble import RandomForestClassifier
from sklearn.model_selection import train_test_split


logger = logging.getLogger(__name__)

@task(cache=True, cache_version="1.0")
def preprocess_data() -> Tuple[pd.DataFrame, pd.DataFrame, pd.DataFrame, pd.DataFrame]:
    """Preprocess iris dataset."""
    iris = datasets.load_iris()
    data = pd.DataFrame({
        'sepal length':iris.data[:,0],
        'sepal width':iris.data[:,1],
        'petal length':iris.data[:,2],
        'petal width':iris.data[:,3],
        'species':iris.target
    })
    X = data[['sepal length', 'sepal width', 'petal length', 'petal width']]  # Features
    y = data[['species']]  # Labels
    X_train, X_test, y_train, y_test = train_test_split(X, y, test_size=0.3)
    return X_train, X_test, y_train, y_test

@task
def train(X_train: pd.DataFrame, y_train: pd.DataFrame) -> FlyteFile:
    """Train model."""
    clf=RandomForestClassifier(n_estimators=100)
    clf.fit(X_train,y_train['species'])
    joblib.dump(clf, out_path := "cls.joblib")
    return FlyteFile(path=out_path)

@task
def eval(model: FlyteFile, X_test: pd.DataFrame, y_test: pd.DataFrame) -> float:
    """Evaluate model."""
    model.download()
    clf = joblib.load(model.path)
    y_pred=clf.predict(X_test)
    accuracy = metrics.accuracy_score(y_test, y_pred)
    logging.info(f"Accuracy = {accuracy}")
    return float(accuracy)


@workflow
def wf() -> float:
    """Preprocess iris dataset, train and evaluate classifier."""
    X_train, X_test, y_train, y_test = preprocess_data()
    model = train(X_train=X_train, y_train=y_train)
    return eval(model=model, X_test=X_test, y_test=y_test)

if __name__ == "__main__":
    print(f"Accuracy = {wf()}")
In Flyte, you use the @task decorator to define the individual steps in your training pipeline. The @workflow decorator is used to define how these steps are connected. (Take a look at the getting-started guide.)
Let’s install the requirements with pip install flytekit scikit-learn pandas. Now, let’s run the workflow locally:
❯ python workflow.py
Accuracy = 0.9111111111111111
Obviously, this workflow doesn’t require any cloud resources - but for the sake of this tutorial let’s imagine it trained a large deep-learning model that does. Let’s, therefore, execute the workflow in our Kubernetes cluster:
pyflyte run --remote workflow.py wf
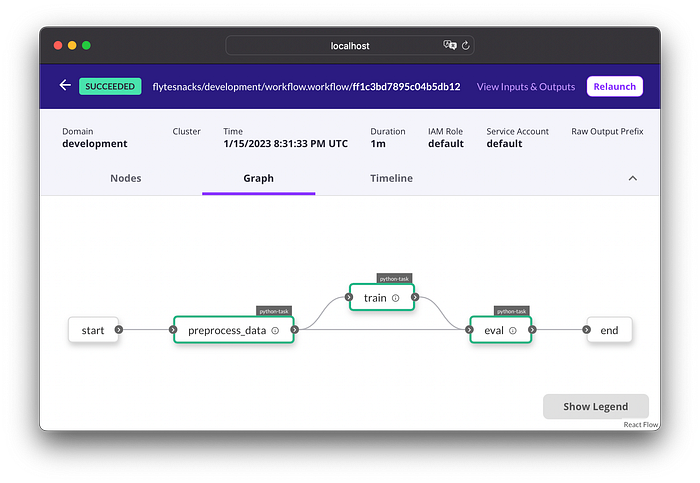
Following the link returned by the command, we can inspect our workflow graph in the Flyte Console:
If you are curious where our training was executed, run this command to see the pods belonging to the tasks:
❯ kubectl get pods --namespace flytesnacks-development(flytesnacks is the default sandbox project, development is the default domain.)
Install the debugger
To attach a visual debugger to the remote training using VSCode, we make use of Microsoft’s debugpy library.
The default docker image used for Flyte tasks doesn’t contain this requirement. Therefore, we create our own image inheriting from the default task image:
FROM ghcr.io/flyteorg/flytekit:py3.8-1.2.5  # The image used by flyte tasks by default

RUN pip install debugpy
Build the Dockerfile above and push the image to the local k3d docker image registry we created:
docker build -t localhost:6000/task-image:latest .
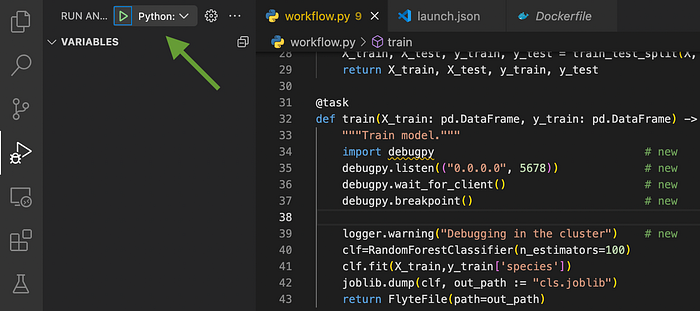
docker push localhost:6000/task-image:latestTo make our training workflow ready for attaching a visual debugger, let’s start the debugpy server (on the default port 5678) and set a debugpy breakpoint e.g. in the training task:
@task
def train(X_train: pd.DataFrame, y_train: pd.DataFrame) -> FlyteFile:
    """Train model."""
    import debugpy                                # new
    debugpy.listen(("0.0.0.0", 5678))             # new
    debugpy.wait_for_client()                     # new
    debugpy.breakpoint()                          # new

    logger.warning("Debugging in the cluster")    # new

    clf=RandomForestClassifier(n_estimators=100)
To prepare VSCode for attaching its visual debugger to the remote training job, we create a.launch.json configuration file:


The resulting .launch.json will look like this:
"version": "0.2.0",
    "configurations": [
        {
            "name": "Python: Remote Attach",
            "type": "python",
            "request": "attach",
            "connect": {
                "host": "localhost",
                "port": 5678
            },
            "pathMappings": [
                {
                    "localRoot": "${workspaceFolder}",
                    "remoteRoot": "."
                }
            ],
            "justMyCode": true
        }
    ]
}
(For completeness sake, I want to point you to a Google VSCode extension called Cloud Code which takes care of the port-forwarding to localhost step shown below. However, it relies on debugpy’s deprecated predecessor ptvsd. In addition, this extension only works with Kubernetes, i.e. it would not work when port-forwarding the debug server e.g. via ssh from a virtual machine.)
Putting it all together
Now, let’s run the workflow again, this time using the image containing the debugpy dependency:
pyflyte run --remote --image k3d-registry.localhost:6000/task-image:latest workflow.py wf(Notice the k3d- prefix which needs to be added to the image tag due to a peculiarity in how k3d handles local image registries).
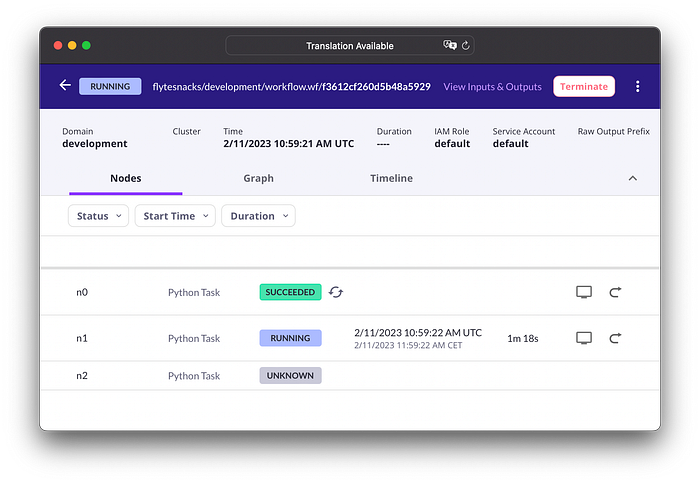
Following the link to the run returned by pyflyte run, you will see that the result of the preprocess_data task has been retrieved from Flyte’s cache. The train task is running and waiting for us to attach to the debugpy server.
Now, retrieve the name of the pod running the task (wait until it has reached the running state) …
❯ kubectl get pods --namespace flytesnacks-development
NAME                        READY   STATUS    RESTARTS   AGE
f3612cf260d5b48a5929-n1-0   1/1     Running   0          3m8s
… and port-forward the debugpy server running on port 5678 to localhost:
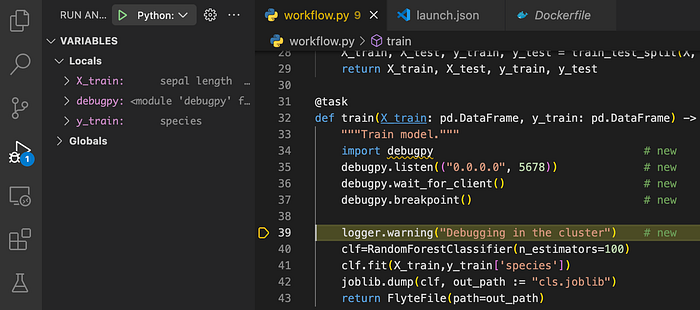
❯ kubectl --namespace flytesnacks-development port-forward pod/f3612cf260d5b48a5929-n1-0 5678:5678In the VSCode Run and Debug view, click the start arrow Python: Remote Attach.
The visual debugger attaches and jumps to the line after the breakpoint.
To convince ourselves that the process we are debugging is actually running in the pod in the Kubernetes cluster - and not on our notebook - we can stream the logs of the pod:
❯ kubectl --namespace flytesnacks-development logs -f f3612cf260d5b48a5929-n1-0Clicking on Step Over …
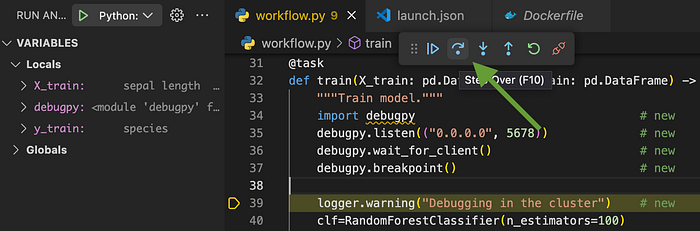
… logs the next line:
❯ kubectl -n flytesnacks-development logs -f f3612cf260d5b48a5929-n1-0
...

Debugging in the cluster
This shows that the process we are visually debugging is, in fact, running remotely. We can, now, enjoy the benefits of a visual debugger and don’t have to rely on iteratively adding print statements and re-starting the training workflow to understand errors in our remote training environment 🚀
Summary
In this tutorial, we deployed a local Kubernetes cluster with k3d, installed the MLOps workflow orchestration engine Flyte, created a simple training workflow, and finally visually debugged it using VSCode and debugpy.
This awesome method can save ML-engineers a significant amount of time compared to iterative print-debugging.
About me
I work as a senior software engineer in the MLOps team at Recogni.
Prior to that I built up and lead the MLOps team at Merantix Momentum. My team and I created an internal developer platform (IDP) which enabled our ML-engineers to self-serve their infrastructure and operations need for the full ML-model life-cycle — significantly speeding up time to production. (Watch my talk at The Linux Foundation Open Source Summit.)