Responsive Charts in Angular With D3.js and CSS
A better pattern for adjusting charts

Hi, everyone. In this article, I’ll explain several problems that I used to find every time I had to do something with a visual component in Angular and D3.
Just to enlighten you, I’ll use a line chart graph based on this example:
It’s nothing too complicated — it’s just for creating something basic like a line chart with random data.
The Problem
There are so many ways to initialise a chart in D3 with Angular, so it can be a problem. Surely, if you did more than three D3 visual components in Angular, you’ve done them in a different way each time.
Let me explain a good way to adjust your charts.
But for the very first step, I’m going to present the instructions to create a new project with Angular and D3.
Creating the Angular project
Use the Angular CLI to quickly set one up:
$ npm install -g @angular/cliThen start a new project:
$ ng new ng-d3-css-example
$ cd ng-d3-css-example
Integrating D3
Its typings in TypeScript:
$ npm install d3 --save
$ npm install @types/d3 --save-dev
Generate the component
Let’s create a component.
$ ng generate component line-chartTemplate
The point here is that for every visual component in D3, I use this code. I love it because it’s only one tag with svg, a class, and an identifier to retrieve it later. That’s it!
<svg #chart class="chart"></svg>Style
The focus here is the .chart class — it allows us to adjust our chart via CSS. It completely separates how we’re sizing charts from other parts, and it’s done only through the style.
line-chart.component.scss
...

.chart {
    width: 240px;
    height: 230px;

    ...
Controller
Have a quick look at the controller — all the magic is in there. Then, I’m going to comment on just a few things.
Obviously, importing D3:
line-chart.component.ts
import * as d3 from "d3";Another task would be retrieving, via @ViewChild, the component itself for adding properties that are always present in all of our visual components.
line-chart.component.ts
@ViewChild("chart", { static: true }) protected chartContainer: ElementRef;  svg: any;
  g: any;  tooltip: any;  margin: {top:number; right:number; bottom: number; left: number;};  contentWidth: number;
  contentHeight: number;  width: number;
  height: number;
All of these properties must be initialised. In fact, we can do it in an ngOnInit cycle of Angular, as we already have everything.
line-chart.component.ts
initChart() {
const element = this.chartContainer.nativeElement;
this.svg = d3.select(element);
this.margin = {
top: +this.svg.style("margin-top").replace("px", ""),
right: +this.svg.style("margin-right").replace("px", ""),
bottom: +this.svg.style("margin-bottom").replace("px", ""),
left: +this.svg.style("margin-left").replace("px", "")
};
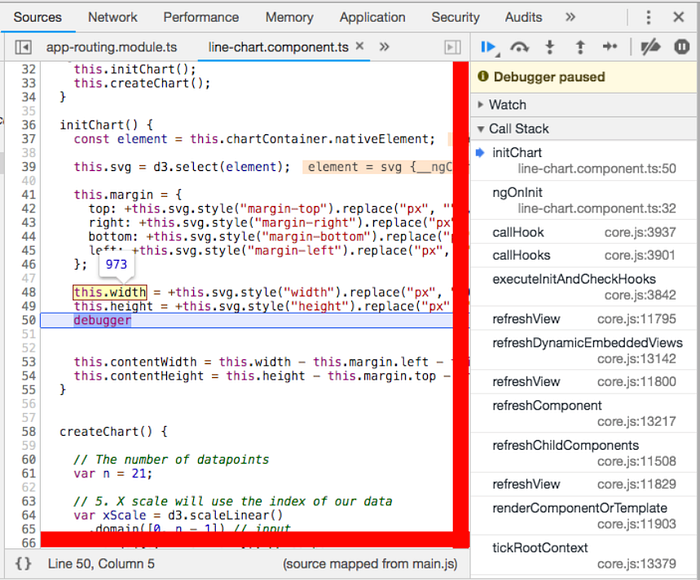
this.width = +this.svg.style("width").replace("px", "");
this.height = +this.svg.style("height").replace("px", "");
this.contentWidth = this.width - this.margin.left - this.margin.right;
this.contentHeight = this.height - this.margin.top - this.margin.bottom;
this.g = this.svg.append("g").attr("transform", "translate(" + this.margin.left + "," + this.margin.top + ")");
}- Putting some margins, etc. to delimitate the content a little bit is almost always mandatory in D3
- We’re converting
widthandheightinto a numeric value, and it’s the key concept here - Indeed, even if you put
%,vw,vh, or another measure in your style, it’ll still be set correctly
Result
After the CSS properties like width and height are set, you’ll be able to check them.
$ npm start
And now, see it’s modified via CSS when I change for this:
.chart {
      //width: 240px;
      //height: 230px;      width: 100%;
      height: 100%;...

D3 is going to set up the width as a numeric. However, before it was retrieved from CSS as the maximum size of 100% (the width attribute in the .chart class).
Finally, you won’t need to adjust your charts anymore in other parts either — not in your templates or in your controllers.
Conclusion
It gave me a headache any time I had to build a chart with Angular and D3. Now, I think from my experience and knowledge, I’ve found a good way to at least initialise them.
I hope you enjoyed, and I hope you learned a new way to adjust charts. Thanks for reading.