The Complete Guide to Convert Python Notebook Into an Interactive Web Application
Creating and deploying web applications for technical analysis of financial data easily
Hello. This article has been prepared to make a technical analysis on financial data with python language and to convert the code we wrote into an interactive web application.
Technical analysis is the most simple way to understand financial stock data, currencies, or different types of financial time series data. Most programmers or data scientists use python language to do basic analysis on financial data because it’s very simple to use.
In addition to the financial analysis code, I want to show you how to convert a python notebook into a web application quickly and easily. It may be helpful for someone who doesn’t know how to program in your team.
If your python notebook code can convert to an interactive web application, everyone uses your python application. Therefore, this post explain how to visualize python code and make it easy to use. A Technical analysis application will be an example for you…
This isn’t an investment advice. I just want to show how to review financial data using the most used technical indicators in python language.
Mercury is a powerful tool for converting a data science application built on a python notebook to an interactive web application. In this article, I’m creating a financial data analysis application using financial indicators on a python notebook converting it into a web application using mercury and deploy to Heroku free dyno service to use on the Web. I think the tool will be very useful for python developers or anyone who knows python language working on data science topics and it will simplify quick analyses. You’ll have a dashboard to show anyone who does not know programming at the end of this post.
On the other hand, you will learn how to:
- calculate some technical indicators and visualize them for financial data in python language,
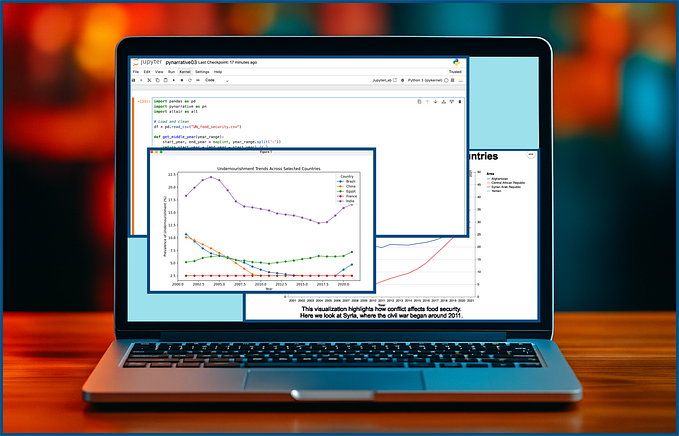
- create a dashboard in the Jupyter Notebook or visual studio code Jupyter extension,
- convert notebook to a dynamic web app with Mercury,
- deploy a notebook-based dashboard app to Heroku free dyno.
Technical Analysis and Indicators
Moving Averages (MAs)
In finance, moving averages (MAs) is a technical indicator that is commonly used in technical analysis. Calculating the moving average of a stock is to help smooth out the price data by creating constantly updated average prices. It can support understanding when the price increase or decreases. In python language, a simple moving average can calculate like the code below. It’s a part of my python notebook at the same time.
## calculate 7days, 14days, 21days moving averages
techAnalysis=finData[["Close"]]
if ma_7d:
    techAnalysis["ma_7d"]=techAnalysis["Close"].rolling(5).mean()
if ma_14d:
    techAnalysis["ma_14d"]=techAnalysis["Close"].rolling(14).mean()
if ma_21d:
    techAnalysis["ma_21d"]=techAnalysis["Close"].rolling(21).mean()
In this code, 7 days, 14 days, and 21 days moving averages are calculated over the “Close” data.
MACD
The MACD indicator is a trending momentum indicator that is observed in terms of two different variants of prices. It is obtained by subtracting the 26-day exponential moving average from the 12-day exponential moving average. The signal in the MACD indicator is used as a trigger for buying and selling.
In python language, the MACD indicator can calculate like this way below. I used this way in my mercury application. It’s a quite simple and effective way to calculate MACD in the python language.
# calculate MACD if "MACD" in indicators:
   k = techAnalysis['Close'].ewm(span=12, adjust=False,              min_periods=12).mean()   d = techAnalysis['Close'].ewm(span=26, adjust=False, min_periods=26).mean()   macd=k-d   macd_s = macd.ewm(span=9, adjust=False, min_periods=9).mean()   macd_h = macd - macd_s   techAnalysis['macd_h'] = techAnalysis.index.map(macd_h)   techAnalysis['macd_s'] = techAnalysis.index.map(macd_s)
In this code, we calculated MACD indicator, MACD signal, and MACD histograms and saved them to the techAnalysis data frame.
RSI (Relative Strength Index)
The Relative (Relative) Strength Index (RSI) is an indicator that provides predictions about the direction of the short and medium-term trend calculated by comparing the closing values of the relevant period with the previous closing values of the period. It can be very helpful for us to understand when the investors will sell or buy.
In this code, I used the pandas_ta module to calculate RSI. It’s a quite simple and short way to do this in python.
## RSI calculate
if "RSI" in indicators:
import pandas_ta as pta
techAnalysis["RSI"]=pta.rsi(techAnalysis["Close"],lenght="14")
Now, we have the “RSI” column in the techAnalysis data frame.
Volume
The volume data can use an indicator. It shows how many stocks have changed hands in a certain period in the markets. The volume data is generally used by investors to interpret and confirm price movements.
In this application, volume data is added to the last chart to inform investors more about the price m
Create Python Environment & Install Mercury
If you want to work clear environment, I suggest you create a python virtual environment and work with it. I am using the python virtualenv package to create a python virtual environment.
python3 -m pip install virtualenvThen, let’s create a virtual environment for this project.
python -m venv my_envWe have an environment and we must activate it to use with the code below.
cd my_env
source bin/activate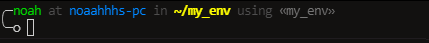
my_env is activated.
To use the used python functions and modules, you should install the required packages below.
matplotlib
pandas
pandas-ta
numpy
pandas_datareader
requests
mplfinance
beautifulsoup4
mljar-mercury
You can copy all and paste into the requirements.txt file. Then you can run the command below and install all required packages easily.
pip install -r requirements.textControlling Mercury server
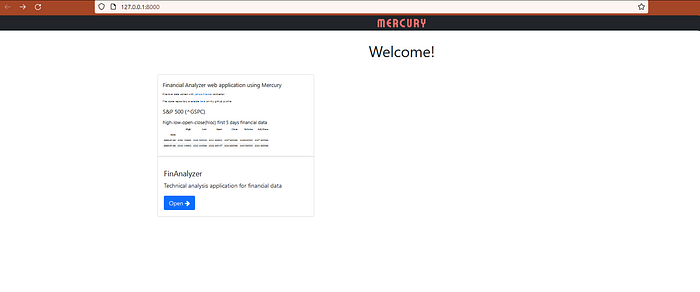
Now, let’s control the mercury server quickly. A simple command is enough to do this.
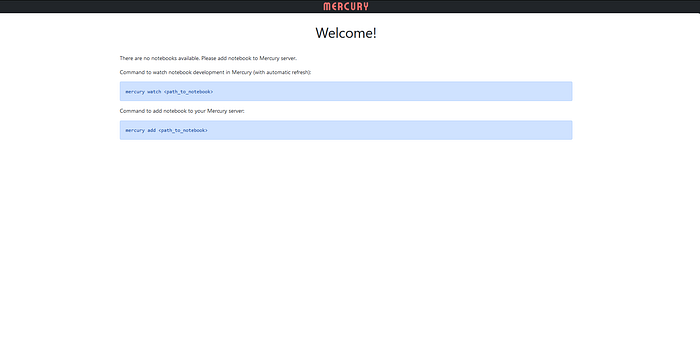
mercury runserver — runworkerLet’s check the https:127.0.0.1/8000 address on your web browser. If you can see the page below, you did it successfully.
To code, It can use Jupyter notebook or vs code Jupyter extension. The thing to be noted is you should choose the Jupyter kernel my_env when using Jupyter notebook or vs code.
If you can’t see my_env, you must add the virtual kernel to Jupyter kernels. For this, You will install the Jupyter package via pip and add kernel via ipykernel package. In my_env dir, you should run the commands below or read the docs in the shared link.
python3 -m pip install jupyter ipykernel
python -m ipykernel install --user --name myenv"
You can check the installed Jupyter kernels with the command below.
Jupyter kernelspec listIf you can see the kernel through the other kernels, you can make sure that is installed to code.
Great! Let’s review my code and convert it into a web application easily !!
Create a python notebook for financial analysis
Yahoo finance
Yahoo finance is a useful website to collect the most financial data simply and fast. You can get historical data free here.
I am using the code below to collect financial data from yahoo finance with python.
import pandas_datareader as dr## date yyyy-dd-mm
start_date= "2015-01-01"
end_date=date.today()
finData=dr.data.get_data_yahoo(ticket,start=start_date,end=end_date)
pandas_datareader module contains the get_data_yahoo function and we can collect historical data easily.
Let’s analyze financial data
In this application, some moving averages, MACD, RSI indicators, and Volume data are used to do simple technical analysis on any financial data.
I plotted the candlestick chart last N days open-close-high-low data and these indicators to one chart. All codes were pushed to my GitHub repository and you can review the code at the gist below.
Convert python notebook into a web application
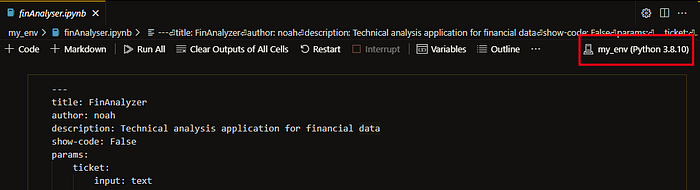
Step 1. Add YAML cell — Mercury framework allows you to define the widgets for the notebook by adding a YAML header at the beginning of the notebook.
Firstly, you must add a blank cell to the top of the python notebook and switch cell type to raw, please.

It’s below the YAML file I have used for the finAnalyzer-mercury application. It will create widgets on the web application. It can be used in many widget types with mercury such as select, text, slider, range, checkbox, etc.
---
title: FinAnalyzer
author: noah
description: Technical analysis application for financial data
show-code: False
params:
   ticket:
      input: text
      label: yahoo finance ticket
      value: "^GSPC"
      row: 1
   year:
      input: range
      label: Select data range of year
      value: [2020,2022]
      min: 2017
      max: 2022
   lastndays:
      input: slider
      label: Select last n days for candlestick chart
      value: 30
      min: 7
      max: 200
   ma_7d:
      label: 7 days Moving averages
      input: checkbox
      value: true
   ma_14d:
      label: 14 days Moving averages
      input: checkbox
      value: true
   ma_21d:
      label: 21 days Moving averages
      input: checkbox
      value: true
   indicators:
      label: Select financial indicators
      input: select
      value: [MACD,RSI]
      choices: [MACD,RSI,Volume]
      multi: True
---
The raw cell will create the widgets below.

Step 2. Assign variable — We must create the same-named variables with our YAML cell and assign the first values. In my code, I assigned the first values under the YAML cell.
ticket = "^GSPC"
year= [2020,2022]
ma_7d=True
ma_14d=True
ma_21d=True
indicators=["MACD","RSI"]
lastndays=30
Step 3. Test — For the test, We can use a local mercury server. Run the code below and open https://127.0.0.1:8000 address your web browser. You can show the application is running on the local mercury server.
Every time you will update the notebook it will be automatically updated in the Mercury
Step 4. Deploy to Heroku Dyno — The dashboard is ready, so let’s deploy it to Heroku.
I assume that you have a Heroku account and Heroku Command Line (CLI) tool installed. But if you didn’t install it, you can check the docs.
Let’s log in to the Heroku-CLI tool:
heroku loginHeroku login screen will be open on your default browser and you must log in this way.
After that, let’s create a Heroku app by running:
heroku create finAnalzer-mercuryIn the project directory, you should use a different project name in the create command because I got the name.
We will need to add a Procfile to our project:
web: mercury runserver 0.0.0.0:$PORT --runworkerLet’s set necessary environment(.env) variables in the dyno:
heroku config:set ALLOWED_HOSTS=fin-analyzer-mercury.herokuapp.com
heroku config:set SERVE_STATIC=True
heroku config:set NOTEBOOKS=*.ipynb
Let’s create a setup.sh file and set environment variables via the command below:
heroku config:set $(cat .env | sed ‘/^$/d; /#[[:print:]]*$/d’)My GitHub repository is an example for you. After them, you are ready to deploy the app by running:
git push heroku mainAnd I have a web application now. It’s available on the link below.
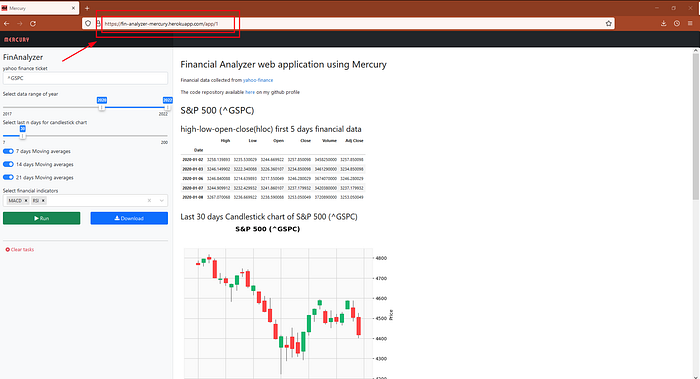
By the way, if you push the codes to your GitHub repository but you must not push the .env file. The file is only Heroku dyno. You can add your .gitignore file easily.
Conclusion
As a result, we used python to get knowledge about financial data with some technical analysis indicators and mercury framework for converting it into a web application in this post.
People use many technical indicators to get knowledge about trends and we used some indicators to get knowledge to interpret data such as moving averages, MACD, RSI and volume here. I think the use of an interactive web application may be a very easy way to review financial data and in this post, we learned how to create a web application by a code on a python notebook.
Mercury is an attractive tool to make a web application from a notebook file using Python. It’s very useful to convert Python notebook into a simple web dashboard application. After all, the application written with Python can be deployed on Heroku free dyno easily.
If there are friends who don’t know Python programming in your team, you can use this method for them. They can use your data science application easily.
My codes and Heroku files are available here.