A Beginner’s Guide to D3.js
D3.js is a JavaScript library for manipulating documents based on data—here’s how to use it.

What is D3?
D3.js is an open source Javascript library that focuses on data-driven document manipulation. “Data-driven document manipulation?” What does that mean?
This means D3 allows you visualise your data through HTML, CSS, or SVG, meaning you can view your visualisation on modern browsers. It allows you to bind data to a DOM (Document Object Model) and transform the document to display your data. There are a lot of awesome designs you can tailor your document to with d3.js
In this guide, we are going to go through some aspects of D3:
- Selection
- Data Binding and Loading
- Data Visualization
- Scaling
- Axis
First things first
Create a directory and open it in your code editor. Create 3 files: index.js, index.css and index.html

In your index.html, make sure you are loading the D3 library as well as your index.js file (and make sure you are using the most recent link to the library).
<script src="https://d3js.org/d3.v5.min.js"></script>Let’s head over to our index.js file and get cracking.
Selection
D3 allows you to identify DOM elements using their name (e.g p,h1) or their CSS selector. How then do we select them for manipulation after identifying them? D3 provides us with 2 methods for selection: d3.select() and d3.selectAll(). They accept either the name of the element or the CSS selector (let’s call this the ‘identifier’) as an argument and return the selection of the element.
What is the difference between these two selection methods? d3.select() returns the first element that matches the identifier and d3.selectAll() returns all the elements that match the identifier. After selection, you can manipulate, style, and bind data to the DOM element.

This will return the first <h1></h1> it finds and colours it blue. If it does not find any h1 tags, it will return an empty selection.

This will return all the<h1></h1> it finds. If it does not find any h1 tags, it will return an empty selection.

With the .attr() method, you can add attributes to the selected element. It accepts two string parameters: the name of the attribute and the value.

With the .text() method, you can update the value of the selected element. It accepts one string parameter: the value.
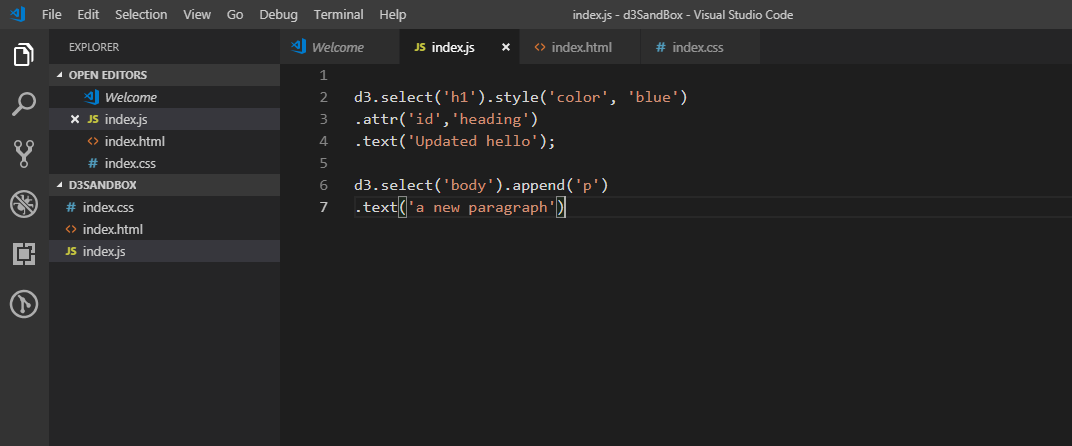
With the .append() method, you can add a new element to the DOM. It accepts one string parameter: the name of the tag.
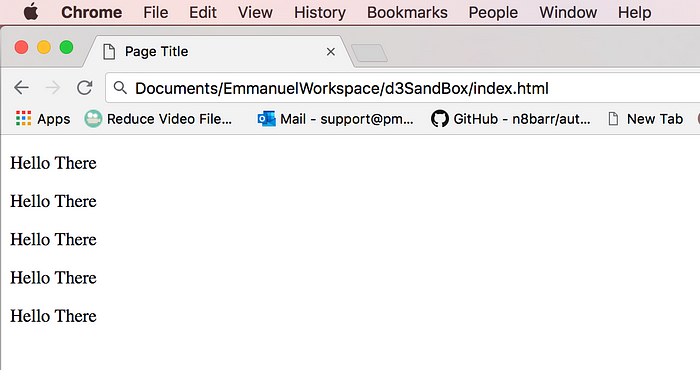
This is what it should look like in your browser.

Task: add more p tags with the append() method and set their value to your favourite food with the text() method; then change their colours to orange using the selectAll() and the style() methods. Please do this task to solidify your knowledge. Don’t worry if you don’t get it in the first try—go through the Selection section again and you’ll get the hang of it.
Data Binding and Loading
With D3, you can load data into your DOM element with the .data() method which accepts your dataset as an argument. With the help of the .enter() method, you can perform a ‘for each element’-like operation on the dataset passed into .data().
Task 2: Change the dataset to contain your favourite dishes and the value of the p tag to the values of the elements from the dataset.
Hint: replace line six with this:
Data Visualization
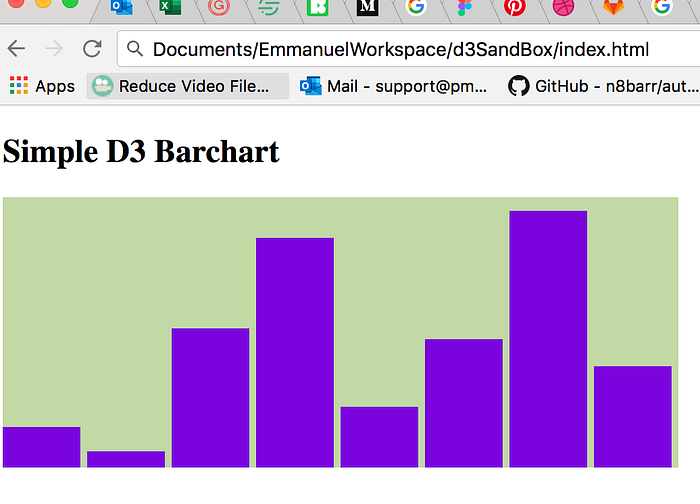
Now that we know a little of the basics, we are going to create a simple bar chart with an arbitrary dataset.
Include an svg tag in your HTML file:
<svg class="bar-chart"></svg>Add this to your index.js file:
That looks like a lot of code, but don’t be alarmed. Go over it again. The width and height of the svg tag are specified in svgWidth and svgHeight respectively, the spacing between the bar is set in barSpacing, and totalBarWidth is the width of the bar(barWidth) and the barSpacing.
Scaling
Hopefully, you were able to successfully create the bar chart. It looks good, right? Do me a favour: change the values in your dataset to numbers lower than 15. How does your bar chart look now? Not so good I guess—the bars are now too small to read. This is where scaling comes into play. We are going to refactor our code to take care of this issue.
The scale variable accepts a .domain() object which takes in one array as an argument. This array has two elements: 0 and the highest value in the dataset (the highest value was retrieved with .max()). The .range() method takes in an array with two elements as well: 0 and how high the bars should be scaled. In the code above, it was set to the svg height. Feel free to add and subtract numbers to the elements in the .domain() and range() argument array. If you refactor the code correctly, your chart should be scalable.
Axis
Well done, you’ve made it this far. This will be the last aspect I will talk about, but at the end I’ll give you some links that have good D3 tutorials.
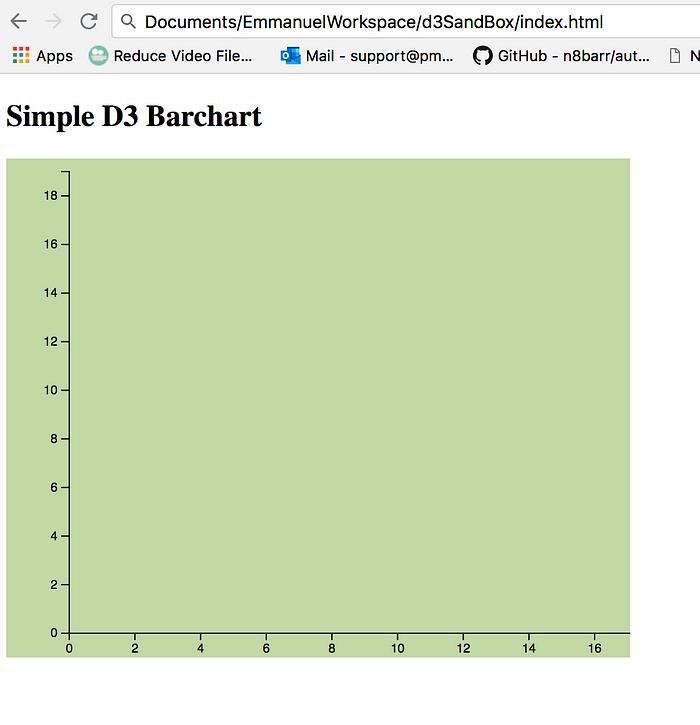
So why do we need an axis? Well, how can you read data correctly without the axis? Through the bars, you can tell that their height varies, but that is not precise enough. We will have to create the vertical and horizontal lines, label them with numbers at equal distances from each other, make sure those labels are scalable… Gosh! That is a lot. Luckily, D3 has some awesome methods that can help with all that in a few lines of code.
To create your x-axis(xAxis) you use the axisBottom()(axis will appear at the bottom) method provided by D3 and pass in your x scale through the scale() method, then you create a group tag in the svg element, add a translate transformation attribute to the group, and call xAxis with the call() method.
To create your y-axis(yAxis) you use the axisLeft()(axis will appear at the left) method provided by D3 and pass in your y scale through the scale() method, then you create another group tag in the svg element, add a translate transformation attribute to the group, and call yAxis with the call() method.
Task 3: Add the bar chart to the axis.
As promised, here are some good resources to help you with your D3.js journey:
https://www.youtube.com/watch?v=C4t6qfHZ6Tw https://www.youtube.com/watch?v=EYmJEsReewo https://www.youtube.com/watch?v=dL5dWNMGy5g
Good luck!

