Member-only story
3 Pandas Functions To Group and Aggregate Data
Import data and do both simple and multiple aggregations
When you work with data in Python, there is surely a library that will never leave your side: pandas. It’s a pretty powerful and intuitive open source library that provides data structures that are useful for dealing with high-dimensional datasets.
There are two principal data structures:
Seriesfor one-dimensional arrays.DataFramefor two-dimensional tables that contain rows and columns.
In this article, I will focus on the most useful functions that split the dataset into groups. Then you can compute statistics, such as average, standard deviation, maximum, minimum, and much more.
You’ll learn to utilize the apply, cut, groupby, and agg functions. They can be very useful to have new insights about the data through graphical representations.
Table of contents:1. Import data2. Simple aggregations3. Multiple aggregations
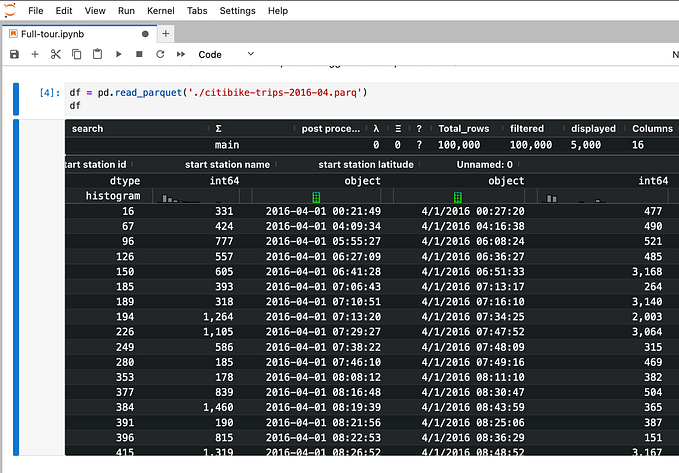
1. Import Data
Let’s import the libraries and the dataset. We’ll use the Boston house prices dataset that is available in the sklearn library.

This DataFrame contains only numeric features, but we need categorical variables to split the dataset into groups. Thus, we’ll create these categorical variables using the descriptive statistics of the data set: