2 Awesome Tools to Automate Client-side Performance Testing
A look at lighthouse and playwright
As applications are getting more complex and testing efforts is over-extended, automating our testing pipelines is paramount.
In this article, I’ll demonstrate how you can use 2 awesome tools to quickly cover multiple test realms with ease.
Introducing Googles’ lighthouse
Googles’ lighthouse is an open-source website quality assessment tool.
It’s based on googles’ web-vitals guidelines and it measures 5 quality factors:
1: performance
This factor has 3 facets:
- Largest Contentful Paint (LCP): measures loading performance. To provide a good user experience, LCP should occur within 2.5 seconds of when the page first starts loading.
- First Input Delay (FID): measures interactivity. To provide a good user experience, pages should have a FID of 100 milliseconds or less.
- Cumulative Layout Shift (CLS): measures visual stability. To provide a good user experience, pages should maintain a CLS of 0.1. or less.
2: Accessibility
I’ve already elaborated on accessibility and its importance in contemporary software development here.
In general, lighthouse lints to improve web sites accessibility in accordance with its web accessibility vitals.
3: Best Practices
This would provide web developers with opportunities to improve the quality of their code.
4: Search Engine Optimization (SEO)
Optimizes search engine results
5: Progressive Web App (PWA)
Keep your website up to date with modern technologies.
Each one of these 5 factors will generate a score from 0 to 100, and the outcome is a detailed report regarding the problems found and the opportunities to fix them.
You can run Lighthouse in 4 main ways:
- From chrome dev tools
- Online
- From cli
- As a node package
Lets focus on the node package option :)
first, we need to install lighthouse package from NPM
npm install lighthouseIn the script above, we started a chrome instance and used it to execute lighthouse on a demo website.
We are only interested in performance, accessibility, and best practices.
Now we can run the script:
node pure-lighthouse.jsThe end result is a detailed HTML report:
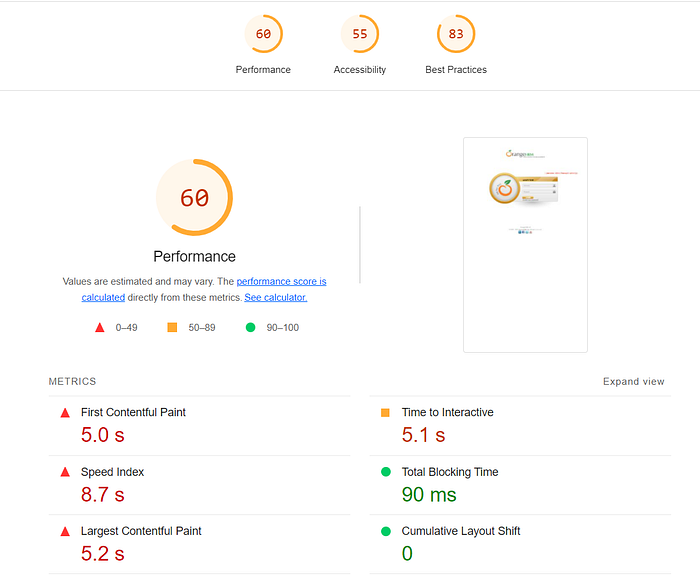
Lighthouse provides awesome reports with amazing details, it can really help identifying quality issues in the web page.
Having the script ready we can execute it in our automation pipelines and easily target these problems.
The problem with this approach, is that we can only test the front page of our application.
We need the ability to navigate between pages and run lighthouse on the current page.
Introducing playwright
Playwright is an open-source web testing automation framework.
Developed by Microsoft, it is designed to use Chrome Dev-Tools Protocol and perform actions on a browser instance such as navigation, clicking elements, text insertion, selecting options from dropdowns, etc.
First, let's install playwright from npm:
npm install playwrightLet's look at a basic playwright script:
In this script, we created a browser, a context, and a page and navigate the page to our demo website.
Then, we can insert our username and password, click on the login button and wait until the welcome element is visible.
Let's run this script:
node pure-playwright.jsIn this example we did not use any testing framework, we want to keep this example framework agnostic.
However, you can easily use any JavaScript-based framework you wish and get a report.
Introducing Playwright-Lighthouse
Now we can put all the pieces to the puzzle.
We’ll use a lighthouse to launch quality assessment, and playwright to navigate through the pages, and playwright-lighthouse will act as the glue that puts these two together.
The strategy is to navigate the page through the web application and then send the instance of this page to lighthouse auditor.
Install the package from NPM first:
npm install playwright-lighthouseNow lets write the test script:
We navigated to the dashboards, passed the page instance to the lighthouse auditor, and defined thresholds for performance, accessibility, and best practices to be 90 each.
Now, let's run this script:
node all-together.jsand the console output is:
-------- playwright lighthouse audit reports --------c:\workspace-vscode\lighthouse-tutorial\node_modules\playwright-lighthouse\src\audit.js:79throw new Error(label);^Error: playwright lighthouse - Some thresholds are not matching the expectations.performance record is 71 and is under the 90 thresholdaccessibility record is 55.00000000000001 and is under the 90 thresholdbest-practices record is 83 and is under the 90 threshold
Sweet! we’ve failed the test and we can see what failed!
Now lets go to the HTML report, it will be under ${current_dir}/lighthouse
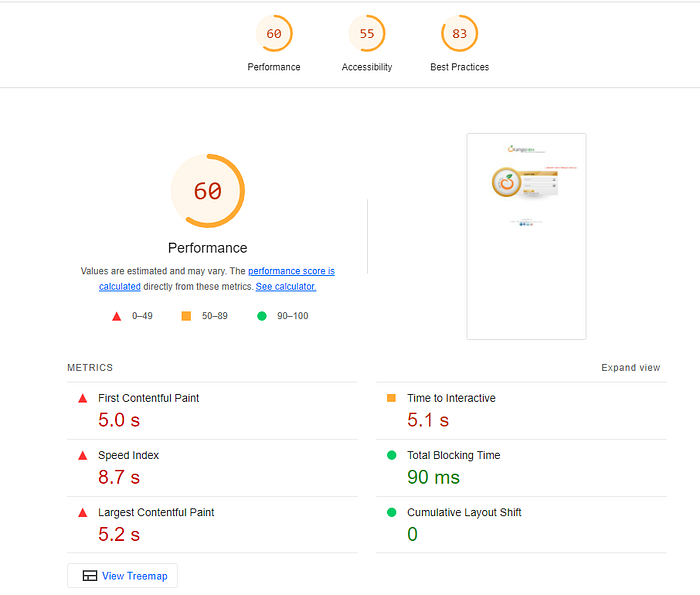
Oh No!
As you can see, lighthouse executed on the login page and NOT on the dashboard page.
It happened because when the lighthouse is started, it opens a new browser instance and all-important authentication details, cookies, and storage are lost!
What we need to do, is to create a persistent browser where the storage is maintained throughout the test, and this can be easily achieved thanks to playwright's amazing API.
So lets fix the script:
So first we created a temp dir wherein we keep all the related storage.
Then, we invoked playwrights launchPersistentContext to create a persistent browser context, then we created a page instance out of the context.
The rest is the same as we so earlier, we passed the persistent page to the lighthouse auditor and invoked quality assessment process.
Let's run the new script:
node all-together.jsConsole output:
-------- playwright lighthouse audit reports --------c:\workspace-vscode\lighthouse-tutorial\node_modules\playwright-lighthouse\src\audit.js:79throw new Error(label);^Error: playwright lighthouse - Some thresholds are not matching the expectations.performance record is 19 and is under the 90 thresholdaccessibility record is 67 and is under the 90 thresholdbest-practices record is 75 and is under the 90 threshold
Cool, now let's take a look at the HTML report:
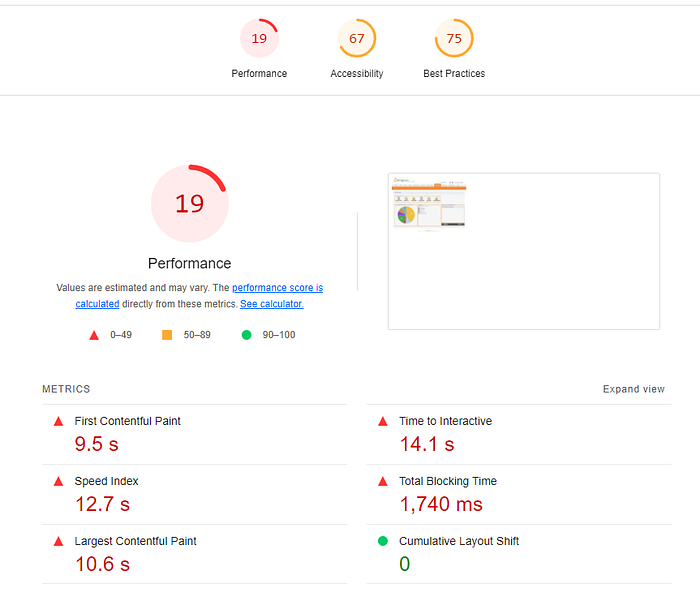
Awesome!

